File:House Heightw from Lidar.png
House_Heightw_from_Lidar.png (762 × 589 pixels, file size: 191 KB, MIME type: image/png)
Summary
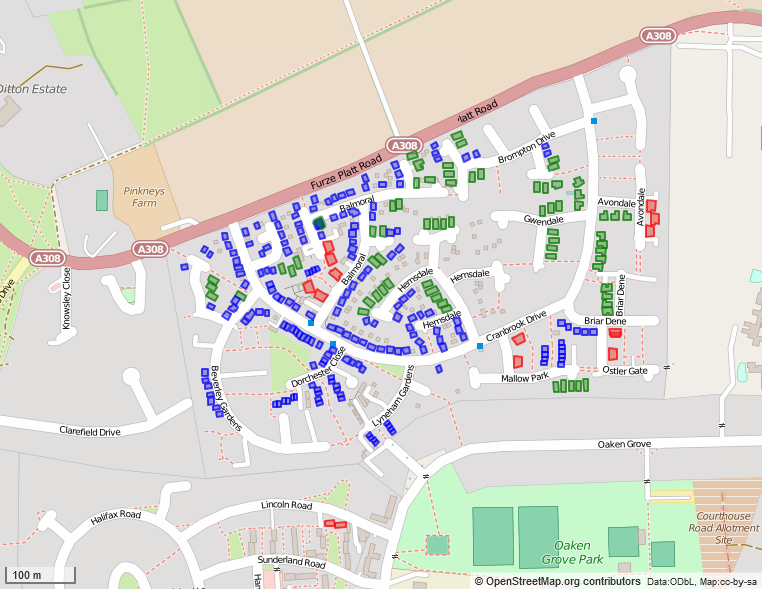
A 1980s housing estate with building heights mapped from English Environment Agency LIDAR Open Data. Buildings fall into 3 height categories: bungalows (green: approx 4m high), 2-storey houses of various kinds (blue: approx 6 m high), and maisonettes (condominiums) which are about 7 m high (red). Heights were calculated in m, so the values represent minimum heights of the highest part of the building, which is nearly always gable line. Via umap.
Licensing
| Contains map data © OpenStreetMap contributors, made available under the terms of the Open Database License (ODbL).
The ODbL does not require any particular license for maps produced from ODbL data, produced maps may be subject also to other licences. |
File history
Click on a date/time to view the file as it appeared at that time.
| Date/Time | Thumbnail | Dimensions | User | Comment | |
|---|---|---|---|---|---|
| current | 13:59, 21 October 2015 | | 762 × 589 (191 KB) | SK53 (talk | contribs) | A 1980s housing estate with building heights mapped from Environment Agency (England) Lidar Open Data. Buildings fall into 3 height categories: bungalows (green: approx 4m high), 2-storey houses of various kinds (blue: approx 6 m high), and maisonettes... |
You cannot overwrite this file.
File usage
The following page uses this file: