File:Philippines node density increase from 2016-04-01 to 2016-07-01.png
Jump to navigation
Jump to search

Size of this preview: 370 × 599 pixels. Other resolutions: 148 × 240 pixels | 296 × 480 pixels | 474 × 768 pixels | 1,050 × 1,700 pixels.
Original file (1,050 × 1,700 pixels, file size: 508 KB, MIME type: image/png)
Information
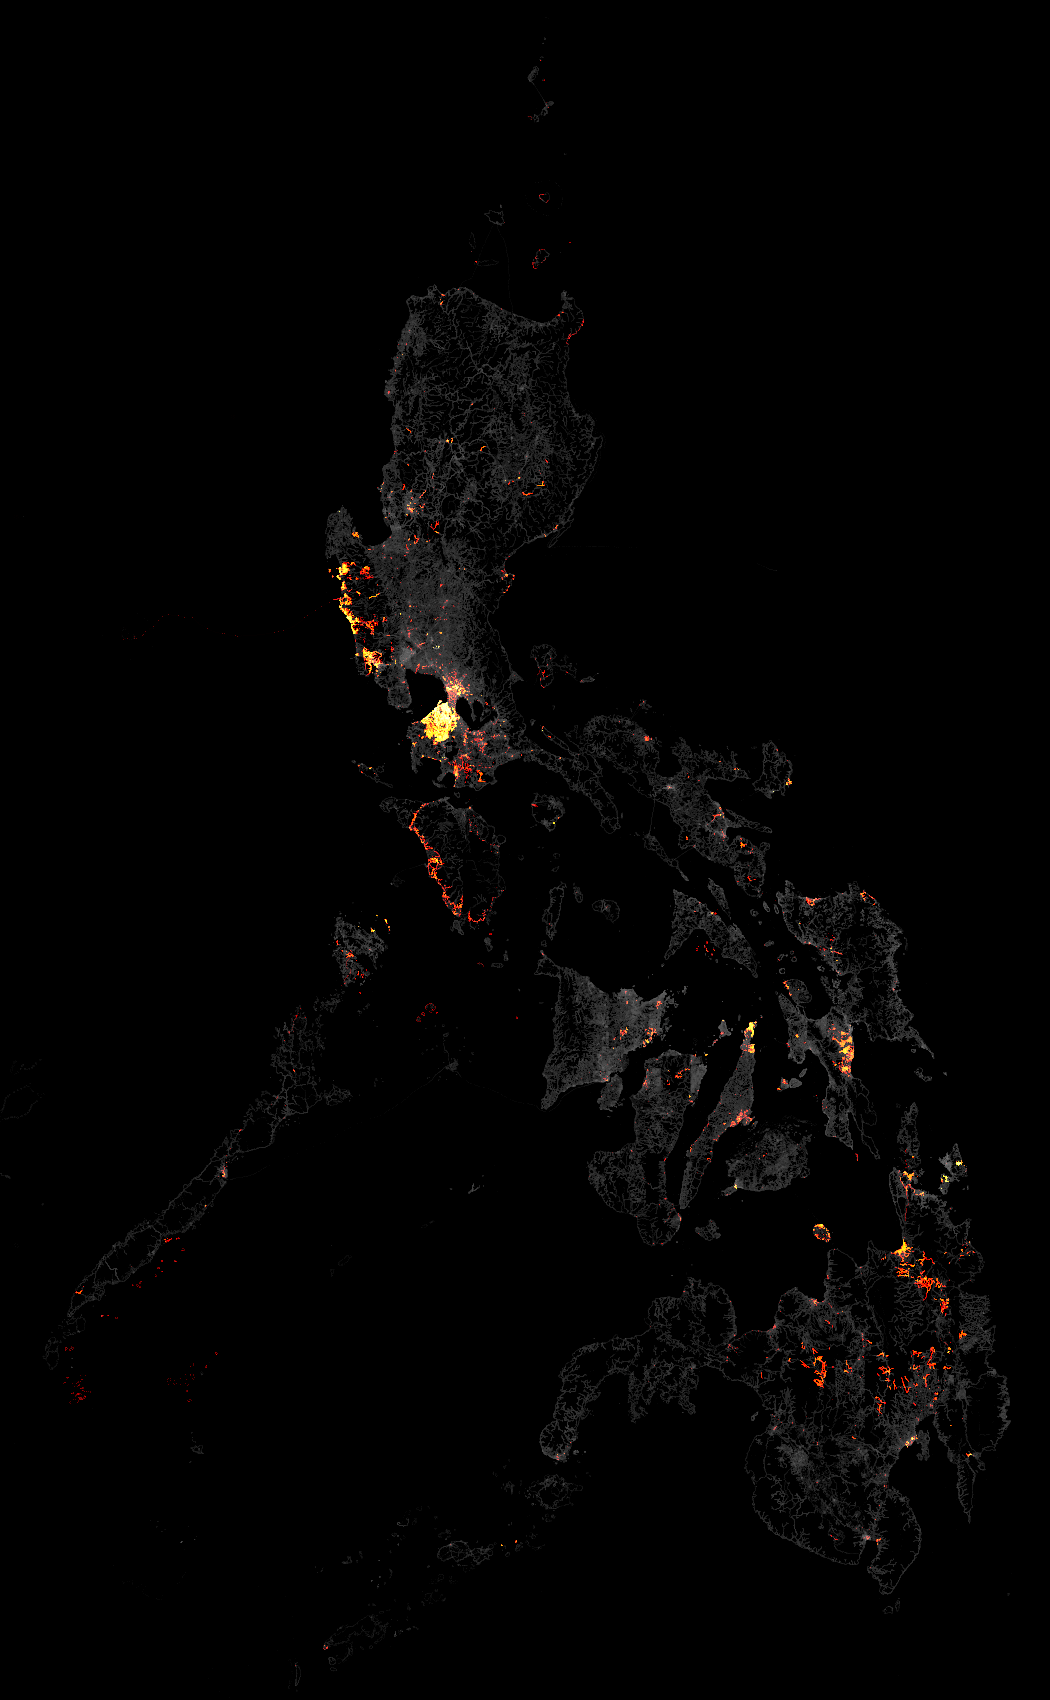
| Description | This is a visualization of the increase in the node density of OSM data in the Philippines between the 2016-04-01 and 2016-07-01 Geofabrik extracts. Each pixel represents a 0.01°×0.01° degree square or approximately 1 square kilometer. Brighter pixels represent areas with higher node count increase. |
|---|---|
| Author | seav |
| Source | Output of a custom script that processed two Philippine OSM extracts. |
| Date | 2016-07-19 |
| Permission | CC-BY-SA 4.0 |
| Other versions | 
|

File history
Click on a date/time to view the file as it appeared at that time.
| Date/Time | Thumbnail | Dimensions | User | Comment | |
|---|---|---|---|---|---|
| current | 03:58, 19 July 2016 | | 1,050 × 1,700 (508 KB) | Seav (talk | contribs) | ==Information== {{Information |Description = This is a visualization of the increase in the node density of OSM data in the Philippines between the 2016-04-01 and 2016-07-01 Geofabrik extracts. Each pixel represents a 0.01°×0.01° degree squar... |
You cannot overwrite this file.
File usage
The following page uses this file: