User:Moresby/Understanding Mapnik/Using CartoCSS
Jump to navigation
Jump to search
Understanding Mapnik
A Mapnik tutorial
Starting with Python
Using XML and CSS
CartoCSS and PostGIS

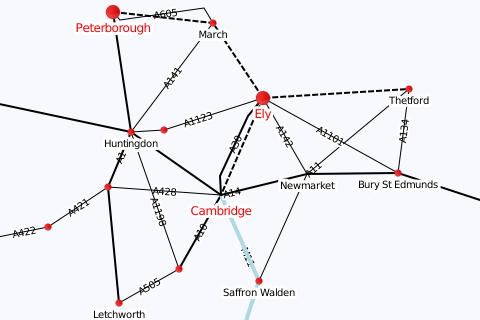
301-carto.png - map generated using CartoCSS
CartoCSS is a tool which allows maps to be designed using CSS-like syntax. It was created by Tom MacWright in 2010 and was influenced by Cascadenik.
For example, the following Cascadenik input files provides a pretty good version of our example map. This is 301-carto.mml:
{
  "Stylesheet": [
                  "301-carto.mss"
                ],
  "Layer":      [
                  {
                    "name":       "line_layer",
                    "class":      "road_lines road_labels",
                    "Datasource": {
                                    "file": "data-roads.csv",
                                    "type": "csv"
                                  }
                  },
                  {
                    "name":       "point_layer",
                    "class":      "town_points town_labels city_points city_labels",
                    "Datasource": {
                                    "file": "data-places.csv",
                                    "type": "csv"
                                  }
                  }
                ]
}
Detailed explanation of this MML file
- This file contains very similar information to the MML file we used for Cascadenik, but in a different format. Instead the XML which we saw with Cascadenik,, CartoCSS uses JavaScript Object Notation (JSON) for its MML file.
- As before, we have a single stylesheet and two layers defined.
- Also as before, each layer specified which CSS classes in the stylesheet are to be applied.
And this is 301-carto.mss:
/* Set background colour to 'ghostwhite'. */
Map {
  background-color: #f8f8ff;
}

/* Specify how to draw the road labels. */
.road_labels [type != 'rail'] {
  text-name:        '[name]';
  text-face-name:   'DejaVu Sans Book';
  text-size:        10;
  text-fill:        #000;

  text-placement:   line;
  text-halo-radius: 2;
}

/* For rail, we have a wide dashed line. */
.road_lines [type = 'rail'] {
  line-color:       #000;
  line-width:       2;
  line-dasharray:   6, 2;
}

/* Roads are narrow, black lines. */
.road_lines [type = 'road'] {
  line-color:       #000;
  line-width:       1;
}

/* Main roads are wider, black lines. */
.road_lines [type = 'mainroad'] {
  line-color:       #000;
  line-width:       2;
}

/* Main roads are wide, light blue lines. */
.road_lines [type = 'motorway'] {
  line-color:       #add8e6;
  line-width:       4;
}

/* Towns are marked with a small circle. */
.town_points [type = 'town'] {
  point-file:       url('circle_red_8x8.png');
}

/* Towns names are drawn in black. */
.town_labels [type = 'town'] {
  text-name:        '[name]';
  text-face-name:   'DejaVu Sans Book';
  text-size:        10;
  text-fill:        #000;

  text-halo-radius: 3;
  text-dy:          7;
}

/* Cities are marked with a larger circle. */
.city_points [type = 'city'] {
  point-file:       url('circle_red_16x16.png');
}

/* City names are drawn in red. */
.city_labels [type = 'city'] {
  text-name:        '[name]';
  text-face-name:   'DejaVu Sans Book';
  text-size:        12;
  text-fill:        #f00;

  text-halo-radius: 3;
  text-dy:          11;
}
Detailed explanation of this MSS file
- content
You will need
To run this example, you will need:
- Mapnik
- cartocss
- file data-places.csv from this example
- file data-roads.csv from this example
- program generate-map.py from this example