User:Sorbus x kewensis/Vectorising with QGIS
Following on from Tom Chance's vectorising StreetView experiments, I have made my own workflow utilising Gimp and QGIS to vectorise buildings from OS StreetView tiles.
Step one: Preparing the tile in Gimp
Pick a StreetView tile and ensure the corresponding .TFW file is in the same directory.
Open the .TIF file in the Gimp and use the 'Colour Picker' tool to pick up the colour of the features that require vectorising (in this case the buildings). Select the buildings using the 'Select by Colour' tool, keeping the threshold around 20. Note that the anti-aliasing of the original map tile means this selection looks jagged compared to the overall building shape. The following steps will help minimise this jaggedness without rounding the shapes too much: Use 'Shrink...' from the 'Select' menu and shrink the selection by 1 pixel. Now use 'Grow...' from the 'Select' menu and grow the selection by 1 pixel. This should eradicate rough edges to the selection that would cause artefacts in the vectorisation.
Now fill the selection with the foreground colour that you previously picked with the 'Colour Picker' tool using 'Edit', 'Fill with FG Colour'. This gives a uniform colour to the shapes to remove odd coloured pixels from anti-aliasing. Save the file and exit the Gimp.
Step two: Polygonise in QGIS using GDAL
Open up a new document in QGIS and set the project CRS as required (in my case ESPG: 27700). Load the map tile into QGIS as a raster layer, checking the layer CRS matches the project CRS, amending it if required. Use the 'Identify Features' tool check the raster band value of the buildings. In my case, this is '204' and it only applies to the colour of the buildings. Now run the GDAL Polygonise plugin from the 'Raster' menu, ticking on the field name (DN) and load into canvas options. The resulting large .SHP file will have polygons for every area of the image, but we are only interested in those with the value '204'. Run a query on the layer as follows: 'DN' = 204. This will hide all the polygons except the buildings. Save the queried layer as a shapefile, keeping the CRS of the original.
Step three: Refining the result using fTools
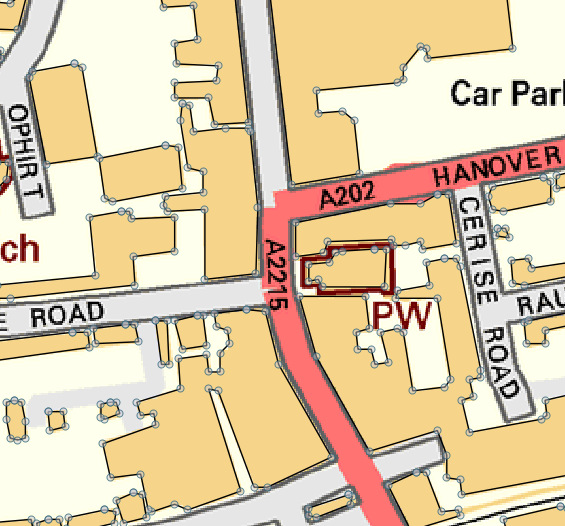
Open this back into QGIS. Note the jagged edges of the polygons, where the individual pixels have been vectorised. Now use the fTools 'Simplify Geometries' plugin from the "Vector' menu. Set the simplify tolerance to somewhere between 1-1.5. Any more than 2 will result in rounded buildings. Note that a very small number of oddly shaped buildings may not remain after this stage. These can be copied over from the original shapefile. Once happy with the results, load this .SHP into Merkaartor for further editing or output as an OSM XML file for JOSM.
As with the other methods, some tidying using orthogonalise and simplify tools will be required, and to compare the building shapes against aerial photos. If anyone comes up with better settings for Gimp or QGIS using this method, then please let me know.
Pros and Cons
Pros:
- Quick, compared to other methods. A 2.4GHz MacBook Pro takes around 15-20 minutes to complete the entire process.
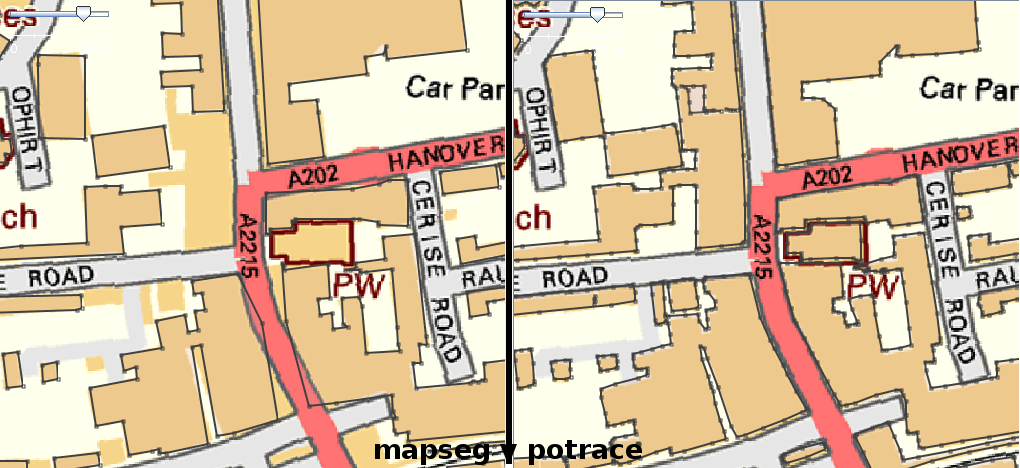
- Most buildings in my tests appear 'truer' than using Potrace or Mapseg.
- Closely neighbouring buildings are less likely to be merged into one shape than using the Potrace method.
- .SHP files are perfectly aligned to the original tile, and do not require scaling/offsetting.
Cons:
- Due to the 'shrink - grow' process in the Gimp, fine features (less than 2-3 pixels wide. See bottom-right of image below) in the original map tile will not vectorise well. Luckily most buildings do not have such fine elements in OS StreetView tiles.
- There are some extra nodes on buildings, placing this method somewhere between using Potrace and Mapseg. Most of these can be removed easily en-masse in Merkaartor using the Simplify command.
- Some corners of buildings aligned on a diagonal can be slightly rounded off.

