File:Edinburgh leisure heatmap.png

Original file (734 × 662 pixels, file size: 840 KB, MIME type: image/png)
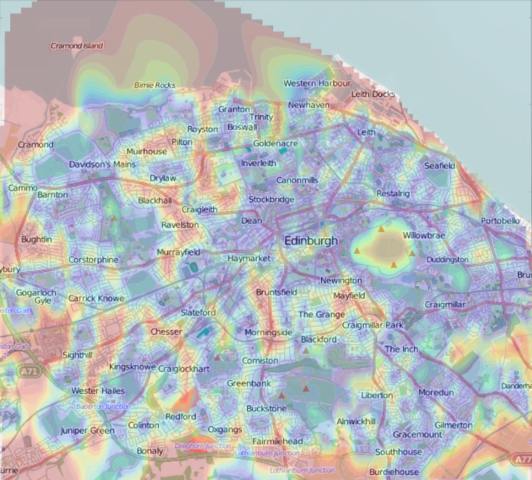
A heatmap of Edinburgh showing access to leisure facilities, using OpenStreetMap data. From an idea by macrofight
Blue areas have good access to leisure areas (such as sports centres, parks, gardens and golf courses) and red areas have poorer access to leisure areas.
Data Copyright OpenStreetMap and contributors, CC-BY-SA, data via www.geofabrik.de/
- Comments and faves
stevefaeembra - flickr - https://www.flickr.com/photos/stevefaeembra/5414584382/
« Boring science bit :-)
Python/Matplotlib to do parsing, processing and contour plot.
Google Earth was used to project the plot onto OSM Mapnik tile layers.
The 'heat' depends on how far each node is to the closest leisure facility node (a node belonging to a way which is marked as 'leisure', such as the nodes marking the boundary of a golf course). I didn't look for single nodes marked as 'leisure', so it's possible that some smaller facilities might have been missed. However, it should have picked up larger areas such as parks, gardens, golf courses and sports pitches. Distances are simple Euclidian distances on (lat,lon). »
Licensing
![]()
![]()
![]()
Attribution: Steven Kay (stevefaeembra), 2011, https://www.flickr.com/photos/stevefaeembra/5414584382/
- Google Earth was used to project the plot onto OSM Mapnik tile layers.
- Python/Matplotlib to do parsing, processing and contour plot.
- OpenStreetMap and contributors for map data, data via www.geofabrik.de
![]()
File history
Click on a date/time to view the file as it appeared at that time.
| Date/Time | Thumbnail | Dimensions | User | Comment | |
|---|---|---|---|---|---|
| current | 13:24, 20 March 2011 | | 734 × 662 (840 KB) | Hawkeyes (talk | contribs) | A heatmap of Edinburgh showing access to leisure facilities, using OpenStreetMap data. From an idea by macrofight Blue areas have good access to leisure areas (such as sports centres, parks, gardens and golf courses) and red areas have poorer access to l |
You cannot overwrite this file.
File usage
The following file is a duplicate of this file (more details):
- File:OpenStreetMap leisure access map for Edinburgh (5414584382).png from Wikimedia Commons
.png)
The following 4 pages use this file: