File:Japan voting station travel times.png
Jump to navigation
Jump to search

Size of this preview: 800 × 368 pixels. Other resolutions: 320 × 147 pixels | 640 × 295 pixels | 1,024 × 471 pixels | 1,280 × 589 pixels | 2,876 × 1,324 pixels.
Original file (2,876 × 1,324 pixels, file size: 2.42 MB, MIME type: image/png)
Summary
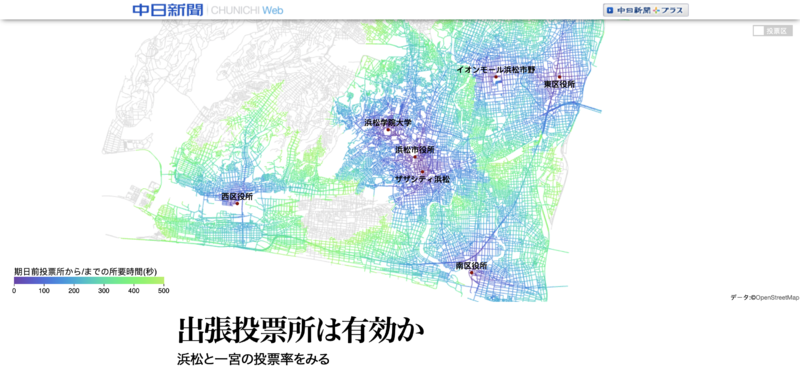
Animated dynamic map of Japan voting station travel times appearing on this chunichi.co.jp article analysing whether turnout improved with provision of more voting stations.
Created by songbogong who thanks the OpenStreetMap community here: https://twitter.com/songbogong/status/1134413124784705536 He used the QNEAT3 plugin for QGIS by Clemens Raffler + webgl & d3js.
Licensing
Created by songbogong. Published here as CC-BY SA 4.0 by permission
![]()
![]()
![]()
This work is licensed under the Creative Commons Attribution-ShareAlike 4.0 License.
Attribution not specified as a parameter! THIS LICENSE ALWAYS REQUIRES ATTRIBUTION! Use {{CC-BY-SA-4.0|Attribution, typically name of author}} See Template:CC-BY-SA-4.0 for full description this template should be used.
Attribution not specified as a parameter! THIS LICENSE ALWAYS REQUIRES ATTRIBUTION! Use {{CC-BY-SA-4.0|Attribution, typically name of author}} See Template:CC-BY-SA-4.0 for full description this template should be used.
File history
Click on a date/time to view the file as it appeared at that time.
| Date/Time | Thumbnail | Dimensions | User | Comment | |
|---|---|---|---|---|---|
| current | 22:33, 2 June 2019 | | 2,876 × 1,324 (2.42 MB) | Harry Wood (talk | contribs) | Animated dynamic map of Japan voting station travel times appear on [https://www.chunichi.co.jp/ee/feature/data/early_voting_stations.html this chunichi.co.jp article]. Created by songbogong who thanks the OpenStreetMap community here: https://twitte... |
You cannot overwrite this file.
File usage
The following 5 pages use this file: