File:OSM-node-density-map-difference-2016-2015.png
Jump to navigation
Jump to search


Size of this preview: 800 × 513 pixels. Other resolutions: 320 × 205 pixels | 640 × 410 pixels | 999 × 640 pixels.
Original file (999 × 640 pixels, file size: 413 KB, MIME type: image/png)
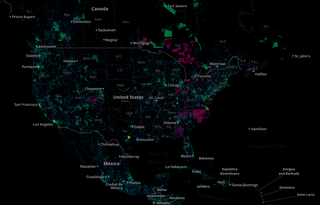
Example of OpenStreetMap node density map as of June 2016: Showing the difference from one year earlier.
- green – more nodes than 2015
- purple – less nodes than 2015
Licensing
Image available under the terms of the Creative Commons Attribution 3.0 Unported license (CC-BY 3.0).
Based on data © OpenStreetMap (ODbL).
The overlay (place names, boundaries, etc.) is © mapbox (which is also based on OSM data).
File history
Click on a date/time to view the file as it appeared at that time.
| Date/Time | Thumbnail | Dimensions | User | Comment | |
|---|---|---|---|---|---|
| current | 13:58, 7 July 2016 | | 999 × 640 (413 KB) | Tyr (talk | contribs) | Example of [http://tyrasd.github.io/osm-node-density/#7/63.541/-350.283 OpenStreetMap node density map] as of June 2016: Showing the difference from one year earlier. * green=more nodes than 2015 * purple=less nodes than 2015 |
You cannot overwrite this file.
File usage
There are no pages that use this file.