File:Osm-gps-density-enhanced-scaled.png
Jump to navigation
Jump to search

Size of this preview: 800 × 400 pixels. Other resolutions: 320 × 160 pixels | 640 × 320 pixels | 1,024 × 512 pixels | 1,280 × 640 pixels | 2,100 × 1,050 pixels.
Original file (2,100 × 1,050 pixels, file size: 699 KB, MIME type: image/png)
Summary
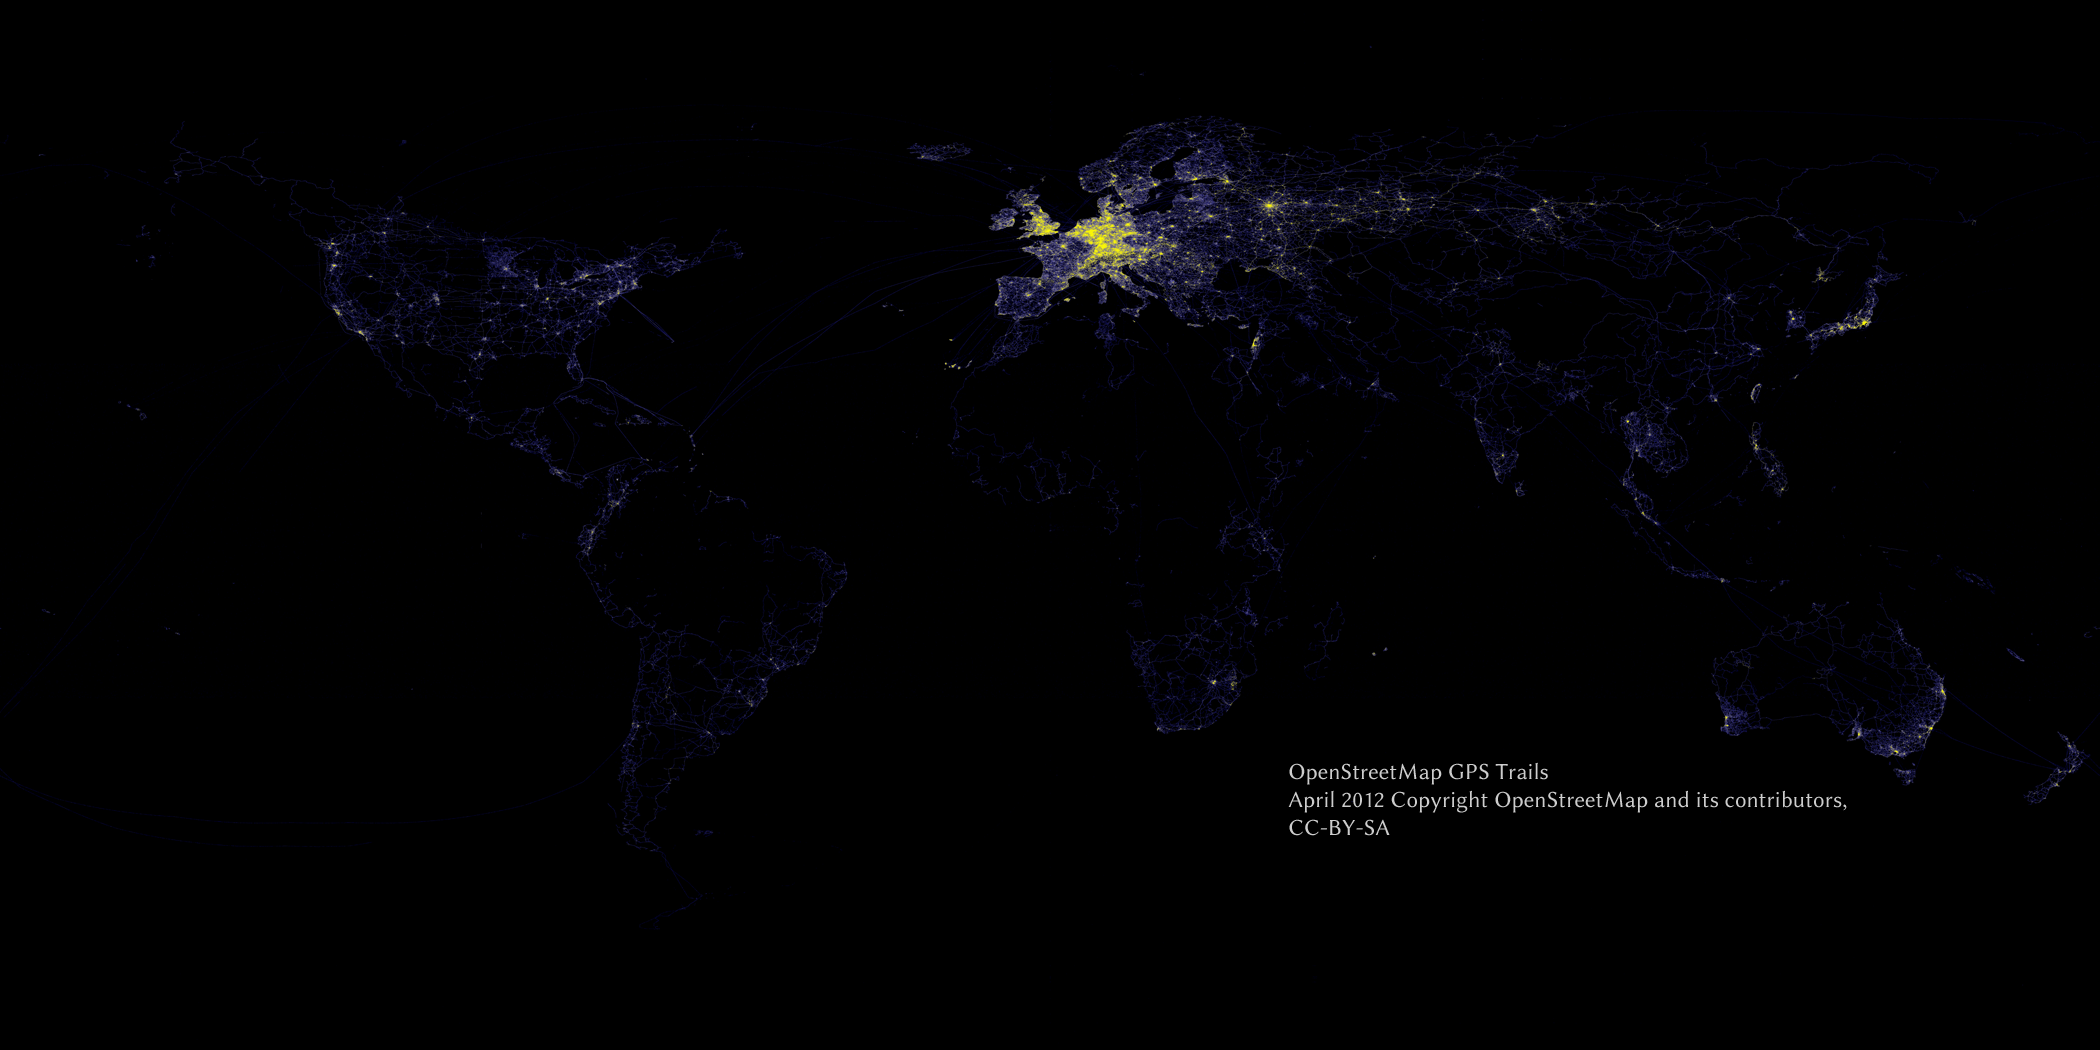
density plot, 2100x1050, based on the GPS bulk data from April 2012 (10% sample)
Yellow areas have high density, blue are lower density.
Equirectangular (Plat Caree) projection
Licensing
![]()
![]()
![]()
This work is licensed under the Creative Commons Attribution-ShareAlike 2.0 License.
Attribution not specified as a parameter! THIS LICENSE ALWAYS REQUIRES ATTRIBUTION! Use {{CC-BY-SA-2.0|Attribution, typically name of author}} See Template:CC-BY-SA-2.0 for full description how this template should be used.
Note, there is
There is also
Attribution not specified as a parameter! THIS LICENSE ALWAYS REQUIRES ATTRIBUTION! Use {{CC-BY-SA-2.0|Attribution, typically name of author}} See Template:CC-BY-SA-2.0 for full description how this template should be used.
Note, there is
{{CC-BY-SA-2.0 OpenStreetMap}} for files based on old OSM map data, before the license change made on 2012-09-12.There is also
{{OSM Carto screenshot||old_license}} for files based on old OSM map data, before the license change made on 2012-09-12, created using OSM Carto map style.
File history
Click on a date/time to view the file as it appeared at that time.
| Date/Time | Thumbnail | Dimensions | User | Comment | |
|---|---|---|---|---|---|
| current | 19:38, 24 September 2012 | | 2,100 × 1,050 (699 KB) | Stevefaeembra (talk | contribs) | density plot, 2100x1050, based on the GPS bulk data from April 2012 (10% sample) Yellow areas have high density, blue are lower density. Equirectangular (Plat Caree) projection |
You cannot overwrite this file.
File usage
The following page uses this file: