File:Osmviz.jpg
Jump to navigation
Jump to search


Size of this preview: 540 × 600 pixels. Other resolutions: 216 × 240 pixels | 632 × 702 pixels.
Original file (632 × 702 pixels, file size: 202 KB, MIME type: image/jpeg)
Summary
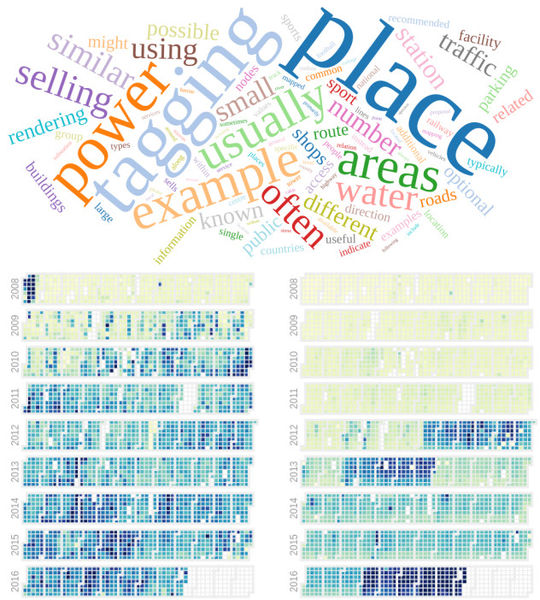
OSMvis is a collection of visualizations related to OpenStreetMap. On the top image, you can see the most frequent words in the OSM Wiki. On the lower left side, the daily amount of new nodes and at the right, the quantity of new users per day. See more visualizations at http://projects.mocnik-science.net/osm-vis/
This is a Featured image, which means that it has been identified as one of the best examples of OpenStreetMap mapping, or that it provides a useful illustration of the OpenStreetMap project. If you know another image of similar quality, you can nominate it on Featured image proposals.
Front-page image for week 4 of 2017 (23–29 Jan.).
- Image descriptions
- Deutsch : OSMvis ist eine Sammlung von Visualisierungen rund um OpenStreetMap. Oben: Die häufigsten Wörter im OSM-Wiki. Links: Anzahl neuer Nodes pro Tag. Rechts: Anzahl neuer Benutzer pro Tag. Weitere Visualisierungen sind verfügbar auf http://projects.mocnik-science.net/osm-vis/.
- English : OSMvis is a collection of visualizations related to OpenStreetMap. Top: Most frequent words in the OSM Wiki. Left: Daily amount of new nodes. Right: Number of new users per day. See more visualizations at http://projects.mocnik-science.net/osm-vis/.
- français : OSMvis est une collection de visualisations relatives à OpenStreetMap. En haut : les mots les plus fréquents dans le wiki OSM ; à gauche : le nombre quotidien de nouveaux nœuds ; à droite : le nombre de nouveaux utilisateurs inscrits chaque jour. Vous pouvez voir d’autres visualisations sur http://projects.mocnik-science.net/osm-vis/.
- italiano : OSMvis è una raccolta di visualizzazioni relative a OpenStreetMap. In alto: le parole più frequenti nel wiki di OSM. A sinistra: la quantità giornaliera di nuovi nodi. A destra: il numero di nuovi utenti per giorno. Altre visualizzazioni sono visibili su http://projects.mocnik-science.net/osm-vis/.
- 中文(简体) : OSMvis 是开放街图相关的视觉化选辑。上面:OSM wiki 上面出现频率最多的字。左边:每日的新节点数。右边:每天的新使用者数量。可以到 http://projects.mocnik-science.net/osm-vis/ 看更多视觉化例子。
- 中文(繁體) : OSMvis 是開放街圖相關的視覺化選輯。上面:OSM wiki 上面出現頻率最多的字。左邊:每日的新節點數。右邊:每天的新使用者數量。可以到 http://projects.mocnik-science.net/osm-vis/ 看更多視覺化例子。
Licensing
![]()
![]()
![]()
This work is licensed under the Creative Commons Attribution-ShareAlike 3.0 License.
Attribution not specified as a parameter! THIS LICENSE ALWAYS REQUIRES ATTRIBUTION! Use {{CC-BY-SA-3.0|Attribution, typically name of author}} See Template:CC-BY-SA-3.0 for full description how this template should be used.
Attribution not specified as a parameter! THIS LICENSE ALWAYS REQUIRES ATTRIBUTION! Use {{CC-BY-SA-3.0|Attribution, typically name of author}} See Template:CC-BY-SA-3.0 for full description how this template should be used.
File history
Click on a date/time to view the file as it appeared at that time.
| Date/Time | Thumbnail | Dimensions | User | Comment | |
|---|---|---|---|---|---|
| current | 13:59, 18 January 2017 | | 632 × 702 (202 KB) | Wille (talk | contribs) | OSMvis is a collection of #visualizations related to OpenStreetMap. On the top image, you can see the most frequent words in the OSM Wiki. On the lower left side, the daily amount of new nodes and at the right, the quantity of new users per day. See mo... |
You cannot overwrite this file.
File usage
The following 13 pages use this file:
- Featured images/Jan-Mar 2017
- List of featured images/2017
- Pt:Featured images/Jan-Mar 2017
- Uk:Featured images/Jan-Mar 2017
- Zh-hans:Featured images/Jan-Mar 2017
- Zh-hant:Featured images/Jan-Mar 2017
- Template:Iotw image/2017-4
- DE:Featured images/Jan-Mar 2017
- FR:Featured images/Jan-Mar 2017
- ES:Imágenes destacadas/Ene-Mar 2017
- IT:Featured images/Jan-Mar 2017
- RU:Featured images/Jan-Mar 2017
- JA:Featured images/Jan-Mar 2017