File:Surging seas climate change New York 10ft.png
Jump to navigation
Jump to search


Size of this preview: 800 × 461 pixels. Other resolutions: 320 × 184 pixels | 640 × 369 pixels | 845 × 487 pixels.
Original file (845 × 487 pixels, file size: 491 KB, MIME type: image/png)
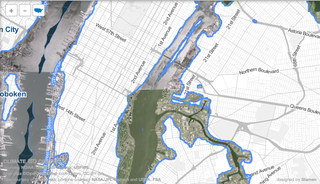
Screenshot of the Surging Seas map showing New York with 10ft sea level rise
This is a Featured image, which means that it has been identified as one of the best examples of OpenStreetMap mapping, or that it provides a useful illustration of the OpenStreetMap project. If you know another image of similar quality, you can nominate it on Featured image proposals.
Front-page image for week 44 of 2012 (29 Oct. – 4 Nov.).
- Image descriptions
- Deutsch : Die Karte "Surging Seas" überlagert OpenStreetMap und Luftbilder, um interaktiv den Anstieg des Meeresspiegels infolge des Klimawandels zu simulieren. Hier sehen wir New York nach einem Anstieg um 10ft, die höchstmögliche Einstellung. Bei der Sturmflut von Hurrikan Sandy gab es einen Anstieg von bis zu 13ft.
- English : The "Surging Seas" map blends OpenStreetMap and aerial imagery to interactively simulate sea level rise due to climate change. Here we see New York after a 10ft rise, the maximum setting. The storm surge of Hurricane Sandy brought a rise of up to 13ft.
- français : les cartes « Surging Seas » (mers chirurgicales) mixent OpenStreetMap et de l'imagerie aérienne afin de simuler la montée du niveau de la mer due aux changements climatiques. Nous pouvons voir ici New York après une montée de 10 pieds (3,04 mètres), le réglage maximum. La chirurgie de tempête de l'Ouragan Sandy à entraîné une montée jusqu’à 13 pieds (3.960 mètres).
- italiano : La mappa "Surging Seas" fonde OpenStreetMap e immagini aeree per mostrare in maniera interattiva l'aumento del livello dei mari dovuto ai cambiamenti climatici. Qui si può vedere New York dopo un aumento di 10ft, l'impostazione massima. L'onda di tempesta dell'uragano Sandy ha portato un aumento fino a 13ft.
- 中文(简体) : 「上升的大海」地图融合开放街图和空照图,用互动的方式呈现因气候变化造成海平面上升。这边我们看到最大的设定值,纽约一带海平面上升 10 英呎。 飓风珊迪的暴雨造成每平面上升 13 英呎。
- 中文(繁體) : 「上昇的大海」地圖融合開放街圖和空照圖,用互動的方式呈現因氣候變化造成海平面上昇。這邊我們看到最大的設定值,紐約一帶海平面上昇 10 英呎。颶風珊迪的暴雨造成每平面上昇 13 英呎。
File history
Click on a date/time to view the file as it appeared at that time.
| Date/Time | Thumbnail | Dimensions | User | Comment | |
|---|---|---|---|---|---|
| current | 00:26, 31 October 2012 | | 845 × 487 (491 KB) | Harry Wood (talk | contribs) | cropped version better |
| 23:54, 30 October 2012 | 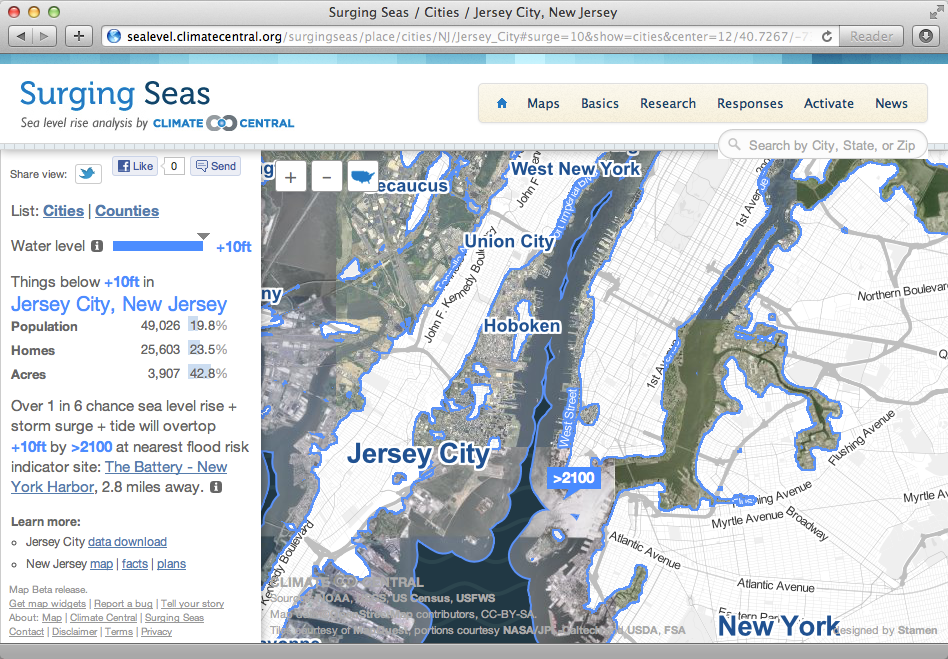 | 948 × 659 (668 KB) | Harry Wood (talk | contribs) | Screenshot of [http://sealevel.climatecentral.org/surgingseas/place/cities/NJ/Jersey_City#surge=10&show=cities¢er=12/40.7267/-73.9997 the Surging Seas map showing New York with 10ft sea level rise] |
You cannot overwrite this file.