User:Frederik Ramm/Freiburg Map
Jochen and I have produced a "real" paper map of the city of Freiburg for the FOSSGIS 2008 conference. The map is an A3, two sided, full colour print, folded just like street maps are usually folded; we have printed 1,000 copies for a total price of 360 Euros plus VAT. One side of the map has a detailed city plan, the other side has a "grand picture" overview and copious OSM advertising on it.
We're very proud of the quality we achieved here. Both maps were created with Osmarender (one with the original XSLT variant, one with my Perl implementation as a "proof of concept"). It was quite a lot of work; we first tweaked the rules file to get the right colours (i.e. the usual colours in German city maps), then we did some modifications on the OSM file itself using JOSM (some of which we uploaded and some not because they were specific for this map, like breaking a way in the middle to achieve better text placement). After that we created the SVG file and fine-tuned that with Inkscape. Finally, a high-resolution PNG was rendered and a finishing touch was applied using the GIMP (removing some rendering artifacts etc). The resulting bitmap was then again imported into a new SVG document, from which we created the PDFs for printing.
A photo of the finished "real printed maps" is here:
http://www.remote.org/frederik/tmp/freiburg.jpg
And the full content, as PDF, is here:
http://www.remote.org/frederik/tmp/freiburg-stadtplan.zip
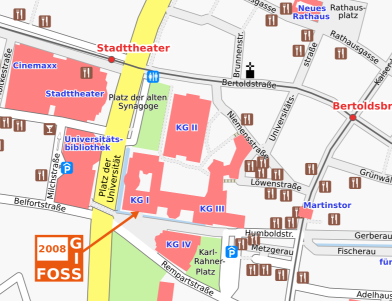
This is an excerpt of the city map:
Everything is Public Domain or CC-BY-SA where it's derived OSM stuff, and I'll gladly make intermediate files (Osmarender rules files etc.) available if there's interest.
Process
Some people have asked about the process we used to create the map, I'll try and remember (the process is the same for the inner city detail and for the overview map, of course one would use different styles for the overview, like omitting the names of residential roads and drawing them as a grey line only).
- Download (preliminary) OSM file for the area (tool used: JOSM)
- Take one of the Osmarender rule files and play with the rules, adjusting colours - in our case, we tweaked roads and buildings especially -, probably changing the scale parameter, changing the width of some roads, choosing your own set of symbols, deciding what amenities should be rendered etc. (tool used: text editor, Osmarender).
- Make a demo print, even if it is only black and white, in the exact size that you want to print later (if your printer cannot handle large paper, choose an extract of the map, just make it so that the width of the road in millimetres is exactly as it will be on the real print later). This will help you judge whether you have chosen good font sizes etc.
- Select the final bounding box and put in the "bounds" element in the rules file (tool used: text editor).
- You will likely have found a lot of bugs in the data by now; fix them in JOSM and then make a final download. This is now your "master OSM file".
- Using JOSM, fix everything that doesn't look good on the map and that you can fix at this stage. Especially, this might include splitting up some streets so that Osmarender does a better label placement. Also you will probably remove many "oneway" tags for those "dual carriageway" kinds of roads. If you want special symbols, like the road number shields we put in, contemplate inserting custom nodes in JOSM and writing a rule in the Osmarender rules file that will place the symbols where these nodes are - one less thing you have to do manually in Inkscape. You might have to move some features (like a footway next to a road or a POI) so that they show up properly on the chosen zoom level. And you might have to delete some details that mess up rendering in the chosen zoom level, such as details at junctions that tend to blend into each other.
- Once you have your OSM file complete, render it with Osmarender and open the resulting SVG in Inkscape. You will want to move a lot of labels, or remove them altogether, maybe insert a few; fixing roads is extremely difficult at this stage and really needs to be done in the previous step.
- If you want a scale, instruct Osmarender to draw one and then simply draw your own, equally-sized scale over it and move it into the picture; it is likely that you don't want the original Osmarender one which sits outside.
- Once you are happy with the Inkscape output, render it into a PNG file of appropriate resolution (400dpi is usually good, i.e. if you have an A3 map this is 42cm wide, that's 16.5 inch, that's 6600 pixels at 400dpi).
- Open the file in the GIMP and fix rendering artifacts, for example the seams at bridges/tunnels, or less-than-optimal coloring on junctions where different kinds of roads meet.
- Use any publishing tool to embed the raster map into something bigger (with title page and all), create a PDF, and give it to the printer. (In doing so, remember that if you want your map to use the whole area, it has to be printed a bit larger and then cut, so you have to allow for a few millimetres extra in your original design).
The whole job for the Freiburg map took us about one man-week, including some data fixes (at one point we had to contact a mapper in Freiburg and send him to check something that looked wrong).
