Linear maps


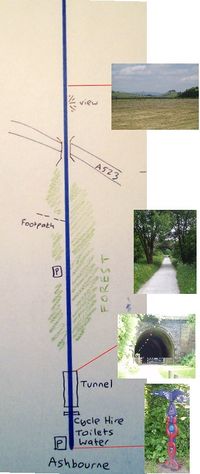
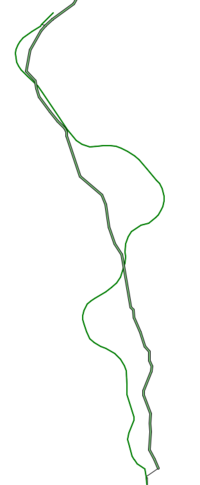
While most maps show a 2D view from above, Linear maps show a single route, arranged in along a straight line, showing features and navigation points along that route. They tend to be used for long distance footpaths, cycle-ways (e.g. converted railways) and of course, railways themselves.
There are several different types of linear maps. One approach illustrated here, involves a completely straight line for the route, and positions measured in miles from the start. So with one of these maps, you can navigate using just a simple pedometer, and points of interest take the form "bike hire at mile 0. toilets at mile 4. layby cafe at mile 11"
Implementations of linear maps
Of most interest would be any automated processing of OpenStreetMap data into a linear map. One example of this so far:
- Overpass API#Public transport example - Overpass API can produce linear maps of transport network data from OpenStreetMap. These are the equal-spaced schematic diagrams we're used to seeing for transport.
- SK53's POI example. Uses PostGIS and pgrouting to create a) single mid-line for streets and b) a tabulation of POIs and their distance along the midline. Such data can be formatted in many ways, but the example uses QGIS.
- Public Transport maps from Dobini (Bartosz Fabianowski and mackerski). Tool chain used Python, Apache etc., but unfortunately was not taken forward for complex reasons.
- Linear Maps tool by Robert Whittaker. Designed to be used to check mapping of high street shops and provide a printable list for use in ground re-surveys.
Non-osm examples of interest:
- d3js strip map demo does a neat animated warping into a linear map with open source javascript. Not using OpenStreetMap data, but could perhaps be modified to do it with OSM.
Ideas
Maths
List the segments in order, then calculate the distance between each one. Store the absolute distance (from the start) of each node, and use that to render.
The distance measuring formula needs to work for very small distances, so Template:Math is probably okay.
It might be useful to divide the route into sections between "significant" changes of direction (see corner detection), and put a bearing on each section to show what direction it's going.
Photos
Do a search of geograph images along the route, and display them as photos on the side of the map.
Stubs and nearby facilities
Would be useful to display stubs of things that cross the path, e.g. when going across a road - need to do a bit of maths to display those properly.
Nodes should be easier, just calculate perpendicular distance from the route, then use that both for filtering out anything further than a certain distance, and for deciding where to display it. (e.g. car parks, shops, "amenities")
Corner detection
There's a standard algorithm for this, where you specify the maxiumum deviation, and it goes through a 2D line detecting corners - anyone know the algorithm's name?
Output options
It might be possible to do things like using HTML tables to generate the map - would be wikipedia-compatible, and means you can create articles about (e.g. some river) with HTML on each segment linking to cities, or displaying images.
Use-cases
- Long distance footpaths, e.g. pennine way, or pembrokeshire coast path
- River guides for kayakers (marking falls, towns, campsites, etc.)
- Railway maps, and tourist railways (where stations are regularly spaced, rather than by exact distance)
- Navigation system for use on motorways (you don't care where the road curves, just what's at each junction)