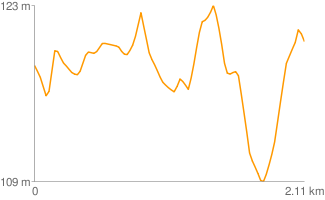
Route altitude profiles SRTM
Goal of this project is to create an altitude profile for (cycle) routes based on the freely available NASA SRTM3 altitude data. Sjors worked on this during the Google Summer of Code 2008 and blogged about his progress.
Objectives and ideas
Striked items are done. The objectives may change however the core objectives will remain. There is a list of open issues on Google Code.
Core objectives
Import SRTM dataAustralia in PostgresA few example tiles in the Google App Engine
Refactor code to:support both a standalone Postgres installation as well as the Google App engine
- Provide a RESTFUL interface
- Input: HTTP/POST (
xml, protocol buffers), HTTP/GET - Output:
xml, protocol buffers, gchart
- Input: HTTP/POST (
Build demonstration website: Done by Artem- Calculate altitudes in route:
return route with altitude points includedinterpolate between points in the route that a far apart compared to image resolutionBilinear Interpolation between SRTM data points
- Performance testing : Partially done
- Provide summary information (nett altitude difference, greatest : Not implemented yet
altitude difference)
Secondary objectives
- Orientation points in profile (from OSM database)
- Full testing suite
- Security
Use memcache- Deal with short spikes (shorter than resolution)
- Proper OpenLS support
- Serve entire planet
The Code
Subversion:
- https://svn.openstreetmap.org/sites/other/route-altitude-profile/
- https://svn.openstreetmap.org/applications/utils/srtm2postgis/
There are also two Git repositories:
- http://github.com/Sjors/openstreetmap-route-altitude-profile/ : the main program
- http://github.com/Sjors/srtm2postgis/ : import SRTM data into Postgres
Dependencies
The following packages are needed by the profile server:
Debian
aptitude install postgresql-8.3-postgis python-pygresql python-psycopg2 python-gdal python-beautifulsoup python-simplejson libapache2-mod-python libapache2-mod-wsgi
Components
Server
This will be the main component.
The server can receive input in three ways and can provide 4 types of output.
http://altitude.sprovoost.nl/profile/output_format/input_format/
output_format can be gchart, gchart_url or xml, see below.
Input format can be xml, protobuf or a GET request.
There are two demonstration servers running at the moment:
- http://altitude.sprovoost.nl/ : runs on the Google App Engine. Only supports the area around Heidelberg and Berlin at the moment. Can probably handle quite a bit of traffic though.
- http://altitude-pg.sprovoost.nl/ : runs on my home computer. Supports all of Europe as far east as Moscow and as far south as Cyprus. Can probably not deal with massive traffic though.
Input
I will demonstrate how to use the different input methods to generate a Google Chart url.
The sequence of coordinates will be the input for the profile. This input could come from a future route planner such as http://www.openrouteservice.org/. I will not create this planner.
XML
The XML document has to be sent through an HTTP/POST request to:
http://altitude.sprovoost.nl/profile/gchart_url/xml/
The XML document should look like this:
<?xml version="1.0" encoding="UTF-8"?>
<xls:XLS xmlns:xls="http://www.opengis.net/xls"
xmlns:xsi="http://www.w3.org/2001/XMLSchema-instance"
xmlns:gml="http://www.opengis.net/gml" version="1.1"
xsi:schemaLocation="http://www.opengis.net/xls
http://schemas.opengis.net/ols/1.1.0/RouteService.xsd">
 <xls:RouteGeometry>
   <gml:LineString srsName="EPSG:4326">
     <gml:pos>8.68108 49.40781</gml:pos>
     <gml:pos>8.68421 49.40777</gml:pos>
     <gml:pos>8.692368 49.40895</gml:pos>
     <gml:pos>8.69267 49.40704</gml:pos>
     <gml:pos>8.693919 49.40688</gml:pos>
     <gml:pos>8.69427 49.40762</gml:pos>
     <gml:pos>8.6923 49.41336</gml:pos>
     <gml:pos>8.69211 49.4148</gml:pos>
     <gml:pos>8.69311 49.41473</gml:pos>
   </gml:LineString>
 </xls:RouteGeometry>
</xls:XLS>
I will try to comply with OpenLS Core Service 5 - the Route Service
Google Protocol Buffers
Learn all about them here.
Obtain altitudeprofile_pb2.py.
If your client is written in Python do something like this:
import altitudeprofile_pb2
import urllib
route = [\
{'lat' : 49.407810, 'lon' : 8.681080},
{'lat' : 49.407770, 'lon' : 8.684210},
{'lat' : 49.408950, 'lon' : 8.692368},
{'lat' : 49.407040, 'lon' : 8.692670},
{'lat' : 49.406880, 'lon' : 8.693919},
{'lat' : 49.407620, 'lon' : 8.694270},
{'lat' : 49.413360, 'lon' : 8.692300},
{'lat' : 49.414800, 'lon' : 8.692110},
{'lat' : 49.414730, 'lon' : 8.693110}\
]
route_pb = altitudeprofile_pb2.Route()

for p in route:
  point = route_pb.point.add()
  point.lat = p['lat']
  point.lon = p['lon']

route_pb_string = route_pb.SerializeToString()

return urllib.urlopen(http://altitude.sprovoost.nl/profile/gchart_url/protobuf/", route_pb_string)
Alternatively you can receive the altitude profile as a protocol buffer, so you can build your own visualization:
return urllib.urlopen(http://altitude.sprovoost.nl/profile/protobuf/protobuf/", route_pb_string)
HTTP/GET
You can obtain either the URL to a Google Chart or the chart itself:
http://altitude.sprovoost.nl/profile/gchart_url?lats=49.407810,49.407770,49.408950,49.407040,49.406880,49.407620,49.413360,49.414800,49.414730&lons=8.681080,8.684210,8.692368,8.692670,8.693919,8.694270,8.692300,8.692110,8.693110
http://altitude.sprovoost.nl/profile/gchart?lats=49.407810,49.407770,49.408950,49.407040,49.406880,49.407620,49.413360,49.414800,49.414730&lons=8.681080,8.684210,8.692368,8.692670,8.693919,8.694270,8.692300,8.692110,8.693110
Example route server
An example route server that shows how to integrate the server into a website. It will allow the user to click on one of the example routes and send the corresponding XML request to the main server. Then it will return the resulting altitude profile to the users browser.
Initial SRTM import
I wrote a script that imports the SRTM data in a PostGIS (PostgreSQL) database. It can import a whole continent or just the area within a bounding box.
I have also written a script that can import 1 SRTM tile into the Google App Engine data store. It's solution is far from perfect.
Methodology
Estimate heights
For each point on the route the script considers the 4 points on the SRTM grid that lay around it and uses bilinear interpolation to estimate the height.
For long straight roads there is another problem: a road may go up and down several times between two consecutive nodes. Additional points are added to the route to deal with this.
Visualization
I will create the actual chart either server side with the Google Chart API or the matplotlib library for python, or client side in some other way.
The profile will be an array of (x,y) coordinates, one for each point along a route, where x is the distance from the origin, via the path and y is the altitude of each point. A point could be a node or any other point along a way.
