File:Touch that data.jpg
Jump to navigation
Jump to search


Size of this preview: 800 × 449 pixels. Other resolutions: 320 × 180 pixels | 640 × 360 pixels | 1,024 × 575 pixels | 1,280 × 719 pixels | 2,592 × 1,456 pixels.
Original file (2,592 × 1,456 pixels, file size: 540 KB, MIME type: image/jpeg)
Summary
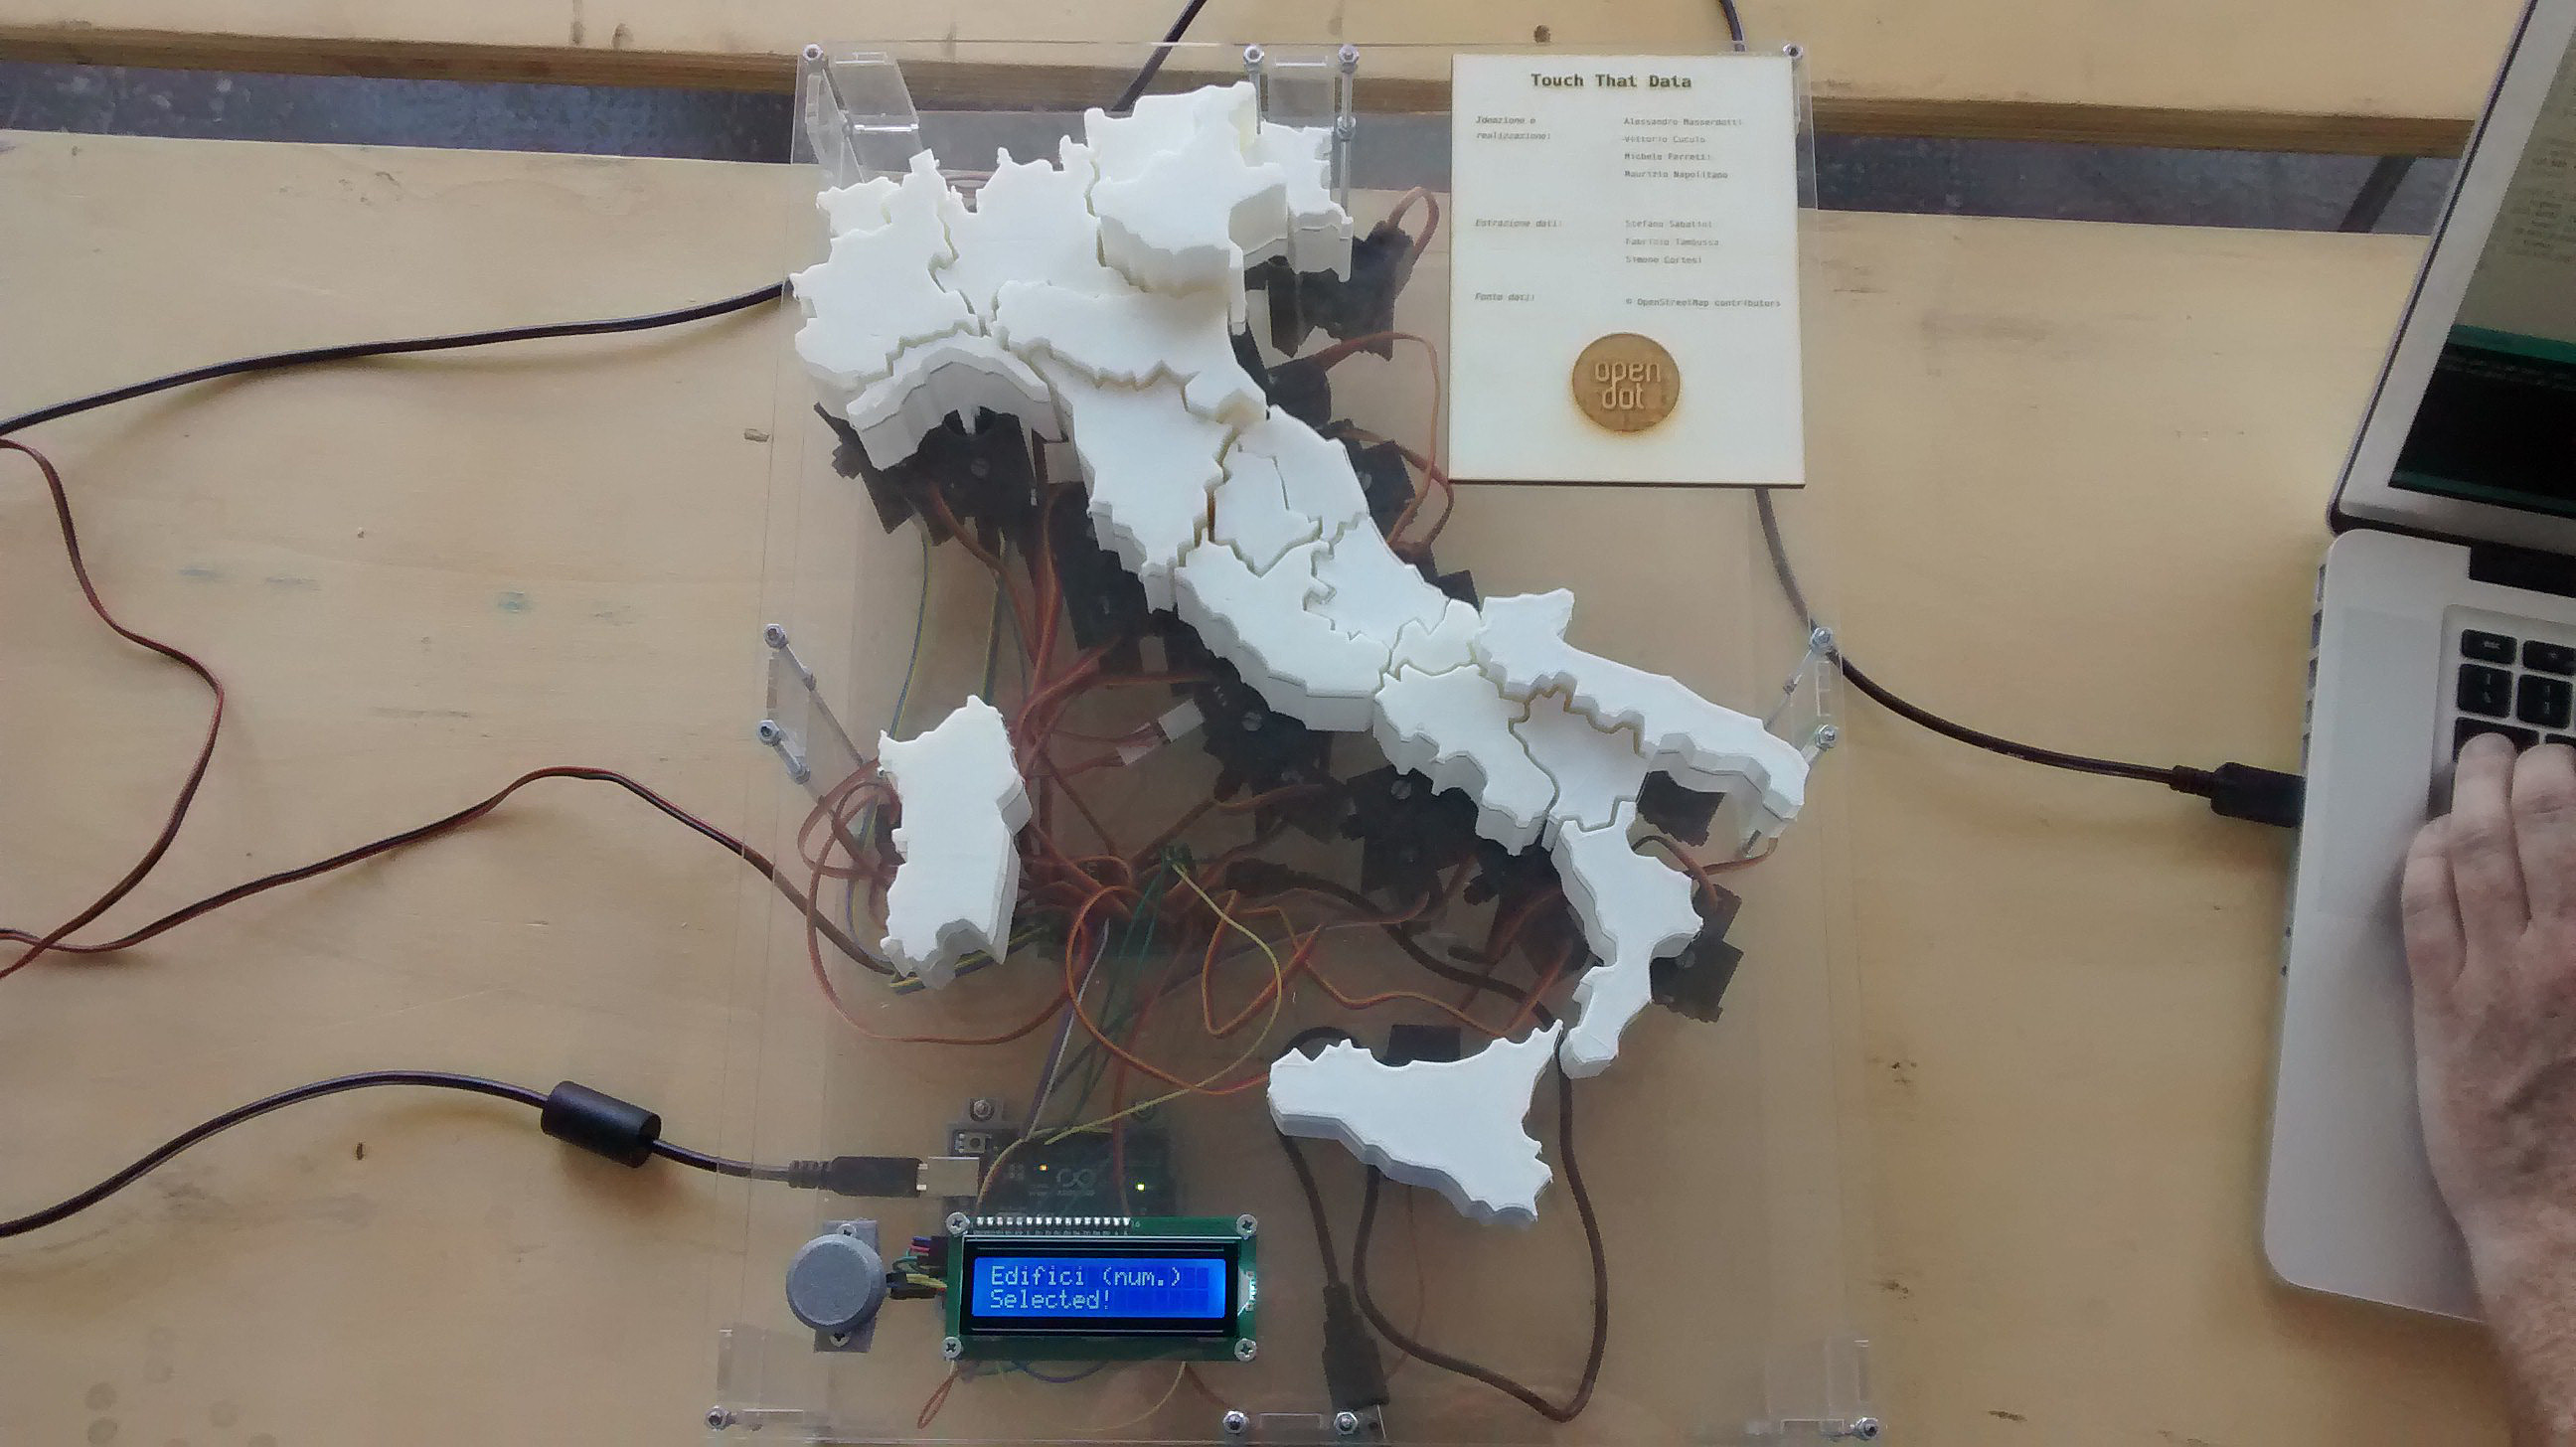
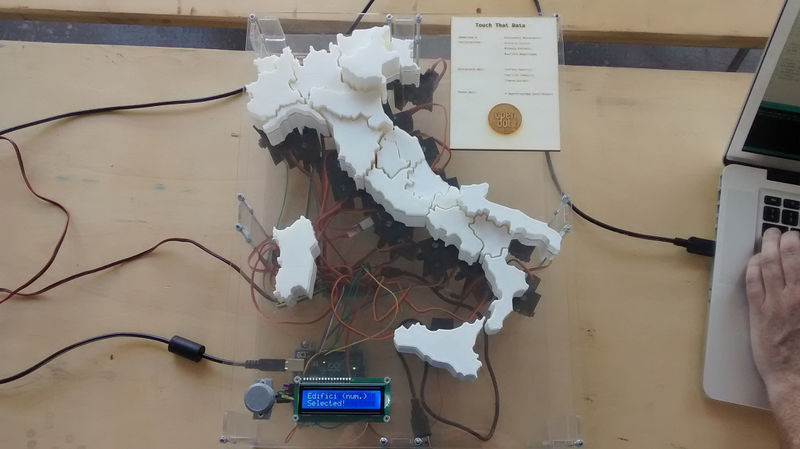
OpenDot Fablab (Milan) project with Arduino and 3D printing visualizes regional statistics changing the height of each region. In the picture there's the building count from the regional extracts.
This is a Featured image, which means that it has been identified as one of the best examples of OpenStreetMap mapping, or that it provides a useful illustration of the OpenStreetMap project. If you know another image of similar quality, you can nominate it on Featured image proposals.
Front-page image for week 26 of 2016 (27 Jun. – 3 Jul.).
- Image descriptions
- English : Presented at OSMit2016, this moving 3D model by OpenDot Lab is the latest way to visualise OpenStreetMap stats! Watch a video here.
- italiano : Presentato a OSMit2016, questo modello 3D dinamico creato da OpenDot Lab è l'ultima maniera per visualizzare le statistiche di OpenStreetMap! Guarda un video qui.
- русский : Эта трёхмерную модель Италии недавно демонстрировали на на местной конференции ОСМ-сообщества. Её подвижные части управляются с компьютера и способны отобразить любую статистику по регионам. Демонстрация работы — на видео.
- 中文(简体) : 在OSMit2016由OpenDot Lab发表的动态3D模型,是最新视觉化开放街图的状况!看这边的影片。
- 中文(繁體) : 在OSMit2016由OpenDot Lab發表的動態3D模型,是最新視覺化開放街圖的狀況!看這邊的影片。
- فارسی : این مدل سه بعدی متحرک که در گردهمایی OSMit2016 توسط آزمایشگاه OpenDot Lab معرفی شد آخرین روش به نمایش درآوردن آمارهای نقشه OpenStreetMap میباشد! این ویدئو را ببینید.
Licensing
![]()
![]()
![]()
This work is licensed under the Creative Commons Attribution-ShareAlike 3.0 License.
Attribution not specified as a parameter! THIS LICENSE ALWAYS REQUIRES ATTRIBUTION! Use {{CC-BY-SA-3.0|Attribution, typically name of author}} See Template:CC-BY-SA-3.0 for full description how this template should be used.
Attribution not specified as a parameter! THIS LICENSE ALWAYS REQUIRES ATTRIBUTION! Use {{CC-BY-SA-3.0|Attribution, typically name of author}} See Template:CC-BY-SA-3.0 for full description how this template should be used.
File history
Click on a date/time to view the file as it appeared at that time.
| Date/Time | Thumbnail | Dimensions | User | Comment | |
|---|---|---|---|---|---|
| current | 14:09, 23 May 2016 | | 2,592 × 1,456 (540 KB) | Sarchittuorg (talk | contribs) | OpenDot Fablab (Milan) project with Arduino and 3D printing visualizes regional statistics changing the height of each region. In the picture there's the building count from the regional extracts. |
You cannot overwrite this file.
File usage
The following 7 pages use this file: