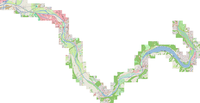
KAP-Dateien aus OSeaMap erstellen
Preface
BSB-Seacharts(KAP-Files) are used in Applications like i.e. OpenCPN.
to convert OpenSeapMap and/or OpenStreetMap Data to a nautical Chart, a picture with the rendered seamarks is needed as a PNG file.
Another way is to create a KAP file directly from an OSM file by using the tool Smrender.
aquiring/creating the Picture File
create Your own Mapnik renderer
- install Mapnik
- adapt render rules
- compute the rendering
- ...
using prerendered tiles
another posibility is, to use the already rendered tiles of the OpenSeaMap Tileserver.
The OpenSeaMap-Server uses the Mapnik Tiles of the OpenStreetMap-Tileserver and overlays them with transparent tiles, which show the seamarks. This mechanism can be used to create a nautical chart in PNG/JPG Format: All needed tiles are downloaded from the Tile-Server of OpenStreetMap and overlays each of them with the tile from OpenSeaMap if any. Last, the overlayed tiles must be combined to a single picture in PNG.
the following Perl script implements this task, calculating the tile names for the needed area. These are downloaded to a dirctory using the 'wget' command and are combined using ImageMagick with the transparent seamark tiles. Next, the tiles are combined to a single picture using ImageMagick again.
Prerequisites:
- Perl-Interpreter
- wget
- ImageMagick
- Internet-Connection
- empty directory to save the tiles
Sourcecode
#!/usr/bin/perl
use Math::Trig;


$level=15;
$latStart = 54.70;
$lonStart = 9.82;
$latEnde = 54.57;
$lonEnde = 10.08;

($xstart, $ystart) = getTileNumber($latStart,$lonStart,$level);
($xende,  $yende)  = getTileNumber($latEnde, $lonEnde, $level);
$xanz = $xende-$xstart;
$yanz = $yende-$ystart;

$urlOSM="http://tile.openstreetmap.org";
$urlOSeaMap="http://tiles.openseamap.org/seamark";


# Status anzeigen
print ("Anzahl x: $xanz\n");
print ("Anzahl y: $yanz\n");

($dummy, $lonStart, $latStart, $$dummy) = Project($xstart,$ystart,$level);
($latEnde, $dummy, $dummy, $lonEnde) = Project($xende,$yende,$level);
print (" -> $latStart, $lonStart, $latEnde, $lonEnde \n");

# Aufräumen
`rm *.png *.log`;

# liegt es im Rahmen?
if ($xanz*$yanz > 25*25) {
   die "to many tiles";
}
# Hauptschleife
for ($x=$xstart; $x<$xstart+$xanz; $x++){
   for ($y=$ystart; $y<$ystart+$yanz; $y++){
       print ("Level, X, Y = $level, $x, $y\n");
       `wget "$urlOSM/$level/$x/$y.png" -o "$level-$y-$x.log" -O "$level-$y-$x.png" `;
       `wget "$urlOSeaMap/$level/$x/$y.png" -o log -O "SeaMap-$level-$y-$x.png" `;
       if ( -e "SeaMap-$level-$y-$x.png"){
          unless ( -z "SeaMap-$level-$y-$x.png"){
             `convert -type PaletteMatte -matte -transparent "#F8F8F8" "SeaMap-$level-$y-$x.png" "SeaMap-$level-$y-$x.png"`;
             `composite "SeaMap-$level-$y-$x.png" "$level-$y-$x.png" "$level-$y-$x.png"`
          }
          `rm "SeaMap-$level-$y-$x.png"`;
       }
   }
}
`montage +frame +shadow +label -tile "$xanz x $yanz" -geometry 256x256+0+0 *.png joined.png`;
#`imgkap joined.png $latStart $lonStart $latEnde $lonEnde joined.kap`;


sub getTileNumber {
   my ($lat,$lon,$zoom) = @_;
   my $xtile = int( ($lon+180)/360 *2**$zoom ) ;
   my $ytile = int( (1 - log(tan(deg2rad($lat)) + sec(deg2rad($lat)))/pi)/2 *2**$zoom ) ;
   return ($xtile, $ytile);
}

sub Project {
  my ($X,$Y, $Zoom) = @_;
  my $Unit = 1 / (2 ** $Zoom);
  my $relY1 = $Y * $Unit;
  my $relY2 = $relY1 + $Unit;

  # note: $LimitY = ProjectF(degrees(atan(sinh(pi)))) = log(sinh(pi)+cosh(pi)) = pi
  # note: degrees(atan(sinh(pi))) = 85.051128..
  # my $LimitY = ProjectF(85.0511);

  # so stay simple and more accurate
  my $LimitY = pi;
  my $RangeY = 2 * $LimitY;
  $relY1 = $LimitY - $RangeY * $relY1;
  $relY2 = $LimitY - $RangeY * $relY2;
  my $Lat1 = ProjectMercToLat($relY1);
  my $Lat2 = ProjectMercToLat($relY2);
  $Unit = 360 / (2 ** $Zoom);
  my $Long1 = -180 + $X * $Unit;
  return ($Lat2, $Long1, $Lat1, $Long1 + $Unit); # S,W,N,E
}
sub ProjectMercToLat($){
  my $MercY = shift;
  return rad2deg(atan(sinh($MercY)));
}
sub ProjectF{
  my $Lat = shift;
  $Lat = deg2rad($Lat);
  my $Y = log(tan($Lat) + sec($Lat));
  return $Y;
}
Python-Tool
GMapCatcher (Windows/Linux) is a nice set of scripts (incl. GUI) to download tiles.
Pros:
- download tiles along a GPX-path (just right for waterways)
- stores tiles in OSM like directory structure (Settings > Custom Maps Directory > 'OSM' instead of 'Files')
In case of a waterway:
- get a GPX-track (eg. JOSM or Waterway Router http://maps.grade.de )
- choose included download tool
- Win
download --gpx=ruhr.gpx --width=1 --min-zoom=1 --max-zoom=1 - Linux
mapdownloader --gpx=ruhr.gpx --width=1 --min-zoom=1 --max-zoom=1 - GMapCatcher-zoom=1 equals OSM-zoom=16
- Win
- started with an empty directory, you will now have the necessary tiles for a map. In this sample at zoomlevel=16, ~ 370 tiles. Same area downloaded via bounding-box: ~1700 tiles!
- following bash-Script http://www.openstreetmap.org/user/mkarau/diary/20256 stitches the tiles together. Missing tiles will be replaceced automaticly by a white image. Upper left and lower right corner are shown in tilenames. This info is needed for further map calibration.
As an alternative, just browse along the waterway while GMapCatcher saves all tiles to disk....
further steps
with the resulting image (PNG) the KAP file can be build using this or imgkap when using imgkap, the calibration & BSB KAP File generation can be done in one step from the Perl script with a line like:
`imgkap joined.png $latStart $lonStart $latEnde $lonEnde joined.kap`;
