Pufferfish Display
Overview
The Pufferfish Display is a method of projecting images onto a spherical display. The company Pufferfish Ltd that makes them is based in Edinburgh. There location is here. There are pictures and videos on their website. The hardware was initially used at State_Of_The_Map_Scotland_2012
This page
This page is to collect experience about the hardware and to provide basic images for Openstreetmap.org under a CCA licence to help others that are using this hardware for the first time.
Present Status
Hardware box has been made and is presently at pufferfish for stress testing. From there it will go to Steven for further software installation. Presently we are looking for stills which we will put on the box. These should be deposited here.
Background Information
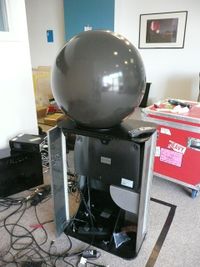
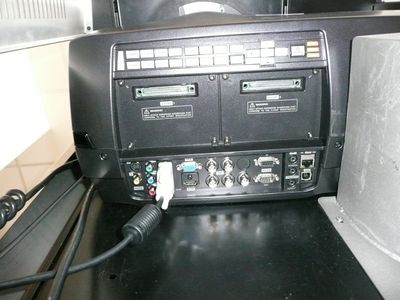
The Pufferfish display consists of a Commercial grade projector which projects a image through a fish-eye lens into a shere. The lens is at the very base of the sphere and cannot be seen in this picture. Also at the base of the sphere is a infra red projector and sensor which is used to interact with the sphere through a second fish-eye lens. The interaction is then received as a X-Y coordinate through a control box seen at the back. More information on the control box later. The the projector works the same as ordinary projectors but the image is sent through the fish-eye lens. The Pufferfish-projector interface is shown here
Two methods of projection
There are two ways of using the pufferfish. Either you take pre warped images and send it through the projector or you can use a hardware image warper to warp a standard image before sending it to the projector. A pre-warped image consists of a 1050x1050 pixel square image with a 75 pixal black band on either side. With the north pole at in the centre. A non-warped image which will be put through the image warper box is a 2:1 image. 2100x1050 pixel with the north pole at the top. This could be done easily through a full screen web page.
Caution
Due to the way that the pufferfish stands it is unlikely that anyone will see the top(north) or bottom(south) of the image
Example from Pufferfish

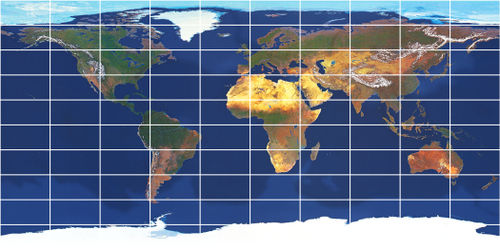
Quoting from Jay from Pufferfish. You'll see that the azimuthal projection has had the south pole cut off. There are two options when showing this projection to allow for the hole in the bottom of the puffersphere: cut off the bottom of the earth in the map or leave the south pole in the map and have the earth's equator slightly further north than it should be.
We need to send an azimuthal projection through the projector's fish-eye lens. This should be a 1050x1050 square image which is normally centred in the projector's highest resolution of 1400x1050. We can work straight off the azimuthal projection or we can develop in an equirectangular format and warp the image into the azimuthal projection before display. For this approach we normally start with a 2100x1050 format. Sometimes we warp the image using graphics shaders or we can use an extra machine which has a video card input which will take the output of the machine showing the equirectangular content and warp it live into the azimuthal projection. This requires an extra machine but is simpler for the developer.
If you work on the equirectangular projection and use our Live PufferWarp box then there's no translation between coordinate systems needed. Otherwise if you mix the projections then it's handy to have a couple of functions to translate between the equirectangular and azimuthal projections. If you normalise the cartesian x and y coordinates (0...1) then to get the same point in normalised azimuthal polar coordinates you take the x to be the distance and the y to be an angle
Pufferfish Videos on Vimeo
Driving Projector from a Processing Sketch
I've come up with a way of taking the output from a normally-drawn Processing sketch and warping it into a polar projection before display. You draw to a sketch (as usual) and the warping is done for you in software in near-real time (7-15 fps).
The results aren't as good as with Pufferfish's own rendering pipeline, though, so for best results with video and stills I'd suggest we use that. (The sketch uses pure software rendering, so is prone to pixelation and 'artifacts')
Tips with processing:
- avoid using grids (graticules) as this makes the artifacts more noticeable.
- distortion is less nearer the equator, bear in mind for text etc.
- use an Equirectangular/Plat Caree globe as the background
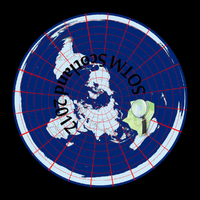 |
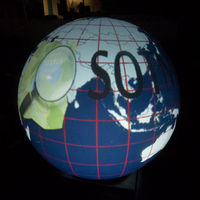 |
--Stevefaeembra 22:17, 7 September 2012 (BST)
Test Images
The pufferfish display is presently in storage for the duration of the festival. We will be able to get to play with it in early september. This page is the location of basic JPG,SVG or GIF images for testing once it comes back.
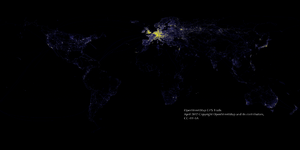
Density plot of GPS points. Data based on a 10% random sample of the April 2012 GPS Bulk Data release. --Stevefaeembra 20:42, 24 September 2012 (BST)
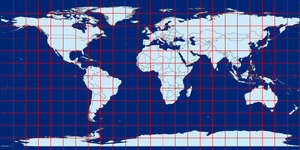
Example OSM-derived continents/coastlines. Equirectangular (Plat Caree), 15 degree graticule. --Stevefaeembra 21:08, 14 August 2012 (BST)
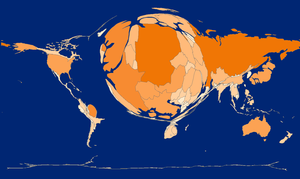
Cartogram of GPS uploads by country. Countries are scaled according to the number of GPS points falling within their boundaries [1]. First draft, based on a fairly small sample. --Stevefaeembra 19:39, 19 August 2012 (BST)
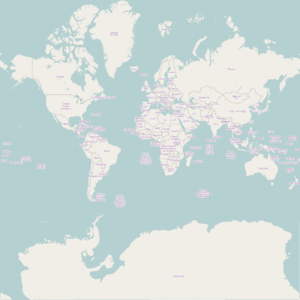
This is the stitched version of the png tiles from the OSM webserver zoom layer2. The resolution is getting close to the high resolution of the pufferfish display. This is to assess what it looks like without any modification, then to create a hacked still image for general use and to play with
Rough Guide to what we would like to accomplish
We will need to create a understated visualisation with the sponsors logos e.g. ITO and Openstreetmap
The different visualisations can be put into different groups.
Still globes, Animated globes, Cartogram globes
- Display the Openstreetmap.org logo - bob
- Display the Openstreetmap.org logo with a banner running around it - completed by steve
- Display a static Openstreetmap Globe - bob
- Display a Openstreetmap Globe video - bob
- GPX density cartogram - finished by steve
Movies
- ITO year of edits 2008 Created at first session
Data Visualisations
Fun Stuff
Rejected
- Display near global realtime edits of openstreetmap.org: We have decided this would be too complex for the results we would get at the present resolution
- Using the export from Openstreetmap.org create a web page and send that straight to the display - bob
- There is a small chance that we may be able to get the interactive version : Pufferfish has recommended that this is not ready for use with the Inspace projector
Questions
This area is for any technical questions that need to be answered
- What is the model of the projector - so we can look for specifications
- What is the mathematical projection used by Openstreetmap - Openstreetmap uses the WGS84 spatial reference system and Mercator (EPSG 3857) for map tiles
- What projections or formulae are best used with the pufferfish - either equirectangular/plat caree, or polar azimuthal equidistant
- What colour space does the projector assume ? (I'd guess this is sRGB)
- Is the projector able to scrape the video from a window, or does it need a full-screen image (in the case of Processing sketches, it's possible to create a full-screen executable on Linux/Mac/Windows)
- Orientation of the Prime Meridian - does this correspond to the "front" of the Projector? - this appears to be the case
External References of possible images for projection on Pufferfish
- Worldmapper Worldmapper is a collection of world maps, where territories are re-sized on each map according to the subject of interest. Example of teenage mothers
- List of derived maps that could be used can be seen here Other_maps
- There are live edit maps in the Other_maps#Art Section
- NaturalEarth offer Public Domain shapefiles - [2]
- OSM-derived coastline shapefiles [3]
- The open source program Stellerium has built in spherical projection to make our own planetarium see Stellarium
- Kde-marble gives various maps in various formats see Marble
- A goldfish bowl
- Historical maps of the world from http://maps.nypl.org (or warped yourself on http://mapwarper.net
Hardware
After the initial play with the pufferfish we have realised that the easiest and best way to experiment with the pufferfish is to have dedicated hardware. It is recommended that we need a decent video card with Dual DVI ports. We don't need a lot of space but speed and reductions in heat production suggest a solid state drive. We want a dedicated machine because we want to mirror the display rather than have dual displays. This makes is easier to use full screen. There are two resolutions we will need 2100 x 1050 and 1050 X 1050 square.
Useful techniques
Gimp Gnu Image Manipulation Program
- If you take an image and use Filter - Distorts - Polar Coordinates, you can warp a static image. There are similar filters in Adobe CS and Elements.
- It is best to keep all images moving
- Distortion is least near the equator