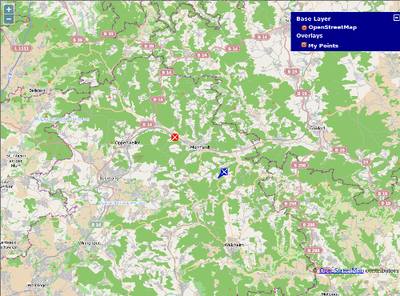
Openlayers POI layer example

Purpose
The intention is to show markers for POIs on top of an OSM Slippy Map. This example shows a very simple way of doing this.
The files
index.html
Copy the following into a new HTML file and name it index.html.
<html><body>
  <div id="mapdiv"></div>
  <script src="http://www.openlayers.org/api/OpenLayers.js"></script>
  <script>
    map = new OpenLayers.Map("mapdiv");
    map.addLayer(new OpenLayers.Layer.OSM());

    var pois = new OpenLayers.Layer.Text( "My Points",
                    { location:"./textfile.txt",
                      projection: map.displayProjection
                    });
    map.addLayer(pois);
 // create layer switcher widget in top right corner of map.
    var layer_switcher= new OpenLayers.Control.LayerSwitcher({});
    map.addControl(layer_switcher);
    //Set start centrepoint and zoom
    var lonLat = new OpenLayers.LonLat( 9.5788, 48.9773 )
          .transform(
            new OpenLayers.Projection("EPSG:4326"), // transform from WGS 1984
            map.getProjectionObject() // to Spherical Mercator Projection
          );
    var zoom=11;
    map.setCenter (lonLat, zoom);

  </script>
</body></html>
Attention: Don't work normally with <!DOCTYPE html>, see the discussion page
textfile.txt
Then create a second file called textfile.txt. It is a tab separated text file, each column being defined in the first line. An example of this file could be:
lat	lon	title	description	icon	iconSize	iconOffset
48.9459301	9.6075669	Title One	Description one	Ol_icon_blue_example.png 24,24	0,-24
48.9899851	9.5382032	Title Two	Description two Ol_icon_red_example.png	16,16	-8,-8
Attention: Please make sure you press ↵ Enter after the last character in the last line. Otherwise the last POI will not work. The space in the title and description items is not the same as the TAB which separates the items.
Also see OpenLayers documentation on Layer.Text for more details.
Icon files
Then you want to download the two icon files that are needed by this example:
Result
All four files have to be in the same folder on your web server.
Now you can open a browser window with the URL of your new index.html file. You will see OSM maps, served from the main server. If you click on the layers switcher symbol ("+" in the top right corner of the map), you will see an overlay layer called "My Points". This layer shows the markers defined by the file textfile.txt. The blue and the red marker on the map are the visible result.
Important
If you publish this example on your website, you are responsible to add all license requirements!