Exporting to Adobe Illustrator
Adobe Illustrator is a vector graphics package, popular in the graphics design and publishing world. This page details approaches to get OpenStreetMap maps into the ".ai" file format for working with in Adobe Illustrator.[1]
Export Tab on OpenStreetMap.org
While you can export SVG files from the Share tab of OpenStreetMap.org, the resulting files are very difficult to edit, containing multiple clipped and masked images. All features are a single layer.
Maperitive

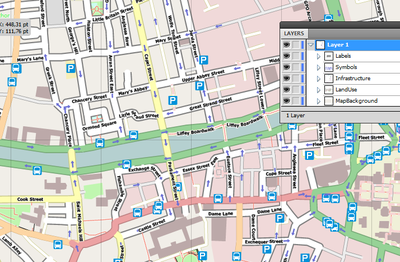
Maperitive can produce high quality (and small-size) SVG rendering specially designed for importing into Adobe Illustrator. It separates map features into SVG layers, takes care of not duplicating shapes and also renders text as normal letters (and not as graphic paths like Mapnik does). Mapnik can load ".osm" files exported from tools such as JOSM, and convert them to Illustrator or Inkscape ready SVG.
A sample SVGZ map of the center of Dublin: http://maperitive.net/samples/Dublin_center_AI.svgz
Maperitive tutorial on exporting to Adobe Illustrator: Generating OSM Map For Adobe Illustrator In Seven Easy Steps
More info about the export-svg command: http://maperitive.net/docs/manual/Commands/ExportSvg.html
osm2ai.pl
The osm2ai.pl script takes OpenStreetMap data and produces an unstyled Adobe Illustrator version 6 file (.ai). You can then work on this in Illustrator to produce a finished map.
Given a bounding box, the script takes all the ways that pass through that area, and draws them (in a Mercator projection). Ways are grouped in Illustrator layers according to their tags. By editing the script, you can determine which tags go to which layers.
Requirements
- The osm2ai.pl script — or — an updated version of osm2ai.pl (February 2013) that supports osm files edited by JOSM.
- Perl and the Geo::Coordinates::OSGB module, plus a few others you almost certainly have already.
- Either:
- (for small areas) an .osm file covering the area you want
- (for large areas) an OpenStreetMap SQL database running on your own machine — typically, a MySQL database created from planet.osm by planetosm-to-db.pl or similar
Using the script
perldoc osm2ai.pl for instructions.
The output
The resulting Illustrator file is version 6, which can still be opened in any modern version of Illustrator.
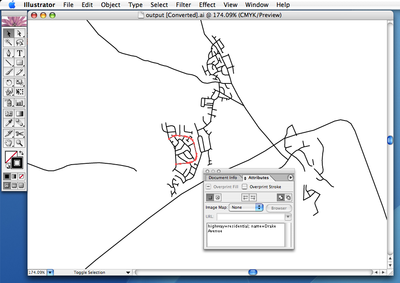
The file is wholly unstyled and unlabelled: the idea is that you make the cartographic styling decisions yourself. However, to help you, the tags (keys/values) are brought through into the file, so that you can see (for example) the name of the road. The keys/values are stored as a "comment". To view these (in Illustrator CS), open the Attributes palette to its fullest extent.
Each way is rendered as a single Illustrator path.
Future plans
- Move to the "Export" tab
- Add constant scaling, etc.
Example
QGIS
In QGIS you can export via AutoCad DXF format into illustrator as follows:
- Download your data directly in Qgis from OSM servers: Vector -> Open Street Map -> Download OSM data. Fill the popup menu and cross "Manual". Then, enter in decimal degrees the area you need for your project (North, West, East, South). Click OK. At the end of the download, close the window.
- Enter the OSM data in Qgis Wien as a new vector layer (all can be imported : points, lines, multilinestrings, other_relations, etc, but some layers are void)
- All your selection of OSM layers is displayed in the layer window. Then after a selection of one layer, by a right click access to the filter window.
- The filter window is easy, there is fields and values columns. To enter a filtering assertion, double click on one field. The field is displayed in the third window, then key press "=" and double click on the value you need. You can add other filtering assertion by the operator "OR". Use test button to know the number of entities of the selection and have a look to the main window of Qgis to see what really happens to your map. When you are satisfied with your filtering, click OK. Now the current layer is filtered, and you must save it.
- Save each of your filtered layer as a vector layer with:
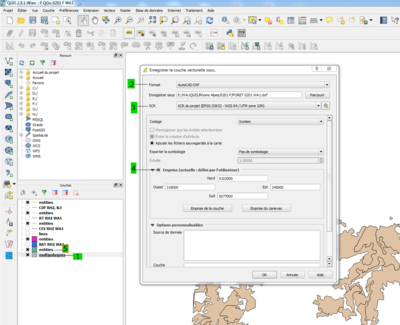
- Layers -> Save As (mandatory because the SCR must be check because for unknown reasons the SCR of your project changes from time to time), and fill the pop up window with the format AutoCadDXF (2), the SCR of your choice (3) and the sub area you need in decimal degrees or UTM meters (4) . This new layer, displayed as "identities" above the current layer, is now ready to be imported in Illustrator (5). "AutoCadDXF" format is a standard format to import vector layers in Illustrator.
- Now to come back to the original and full current layer, select the current layer, go to the filter window and press the "Erase" button. The current layer is now ready for a new filtering assertion.
- Filter your data as vector layers for Buildings (1), Roads, Waters, Forest, etc.., from the lines layer (roads, waters etc..) and multipolygons layer (buildings, landuse, railways etc..)
In Illustrator use: File -> Import. Then, it's quite easy to scale and synchronize your layers in Illustrator.
Potlatch
In Potlatch, you can export to pdf and then open the file in Illustrator. You can do a find and replace to get rid of layers you don't need.
Other approaches
Various other approaches may be possible if you convert via other formats such SVG
External links
- How to get Open Street Map data into Adobe Illustrator with MAPublisher
- http://openvectormaps.com is a library of vector maps in SVG and AI formats. Most maps were produced using Maperitive.
- ScalableMaps has some useful tips on how to improve performance of Illustrator when working with maps.
- Hebstreits offers its own map styles and a high-resolution vector map service for EPS, PDF and SVG formats.
- BoundlessMaps provides layered and fully editable vector maps in AI and PDF formats.

