Distance maps
Concept
To produce a map which indicates the distance from a single (or multiple) location or feature, such as a 'walking distance to school'.
The starting point for this was an indignant posting on the mailing list:
Has anyone done any work in the area of making maps representing 'distance to feature'
as measure along routable roadways/footways?

Local school board is trying to drop school bus service school kids (from grade 1 up)
within 2.0km of school and get them to walk to school (bear in mind this is a rural
community with -60'C winters, wildlife such as cave bears/cougars and a grueling CPR train
route through it).
Obviously there will be 101 variations of this theme and everybody will want something slightly different. The purpose of this page is to provide suggestions on how to achieve the goal and links to the tools to do it.
The user will have to determine how/what they want to render. Some things to think about:
- What mode of transport. Car, foot, bicycle, walking with pram/stroller, etc.
- 'Age' factor; young children, OAP, etc
- Access permissions.
- Specific local limitations which might not be represented in OSM data, such as sidewalks only on one side of the street or un-plowed streets.
Also see Gary68's Distancemap.pl
Also see Safe Routes to School Mapping Toolkit
The Frederik/Mungewell Method

My approach is to take a OSM file, transit each routable way using the dijkstra algorithm to compute the shortest distance from a 'target location' for each node. These lat/long/distance values (optionally interpolating between them, along the ways) can be plotted directly onto a maps as distance markers, or further processed to produce contours.
GnuPlot uses it's dgrid3d function to map lat/long/distance values into a complete matrix convering the whole map area and renders the contours to file as 'vector paths'. They are then converted to a 'contours' OSM file which can be overlaid or merged with original map for plotting with osmarender (or other engine).
The route tracing script was mainly written by Frederik. The contouring is an adaptation of srtm2osm technique. Scripts can be found in SVN.
Workflow
Stage 1: Download/Extract a 'ROUTE.OSM' file of the area, and edit for any special conditions you have, such as removing private roads. The script will route through all connected ways.
Stage 2: Run 'distance.pl ROUTE.OSM <target_lat> <target_lon> [<interpolation>]' script to compute distances from 'target' node.
$ perl distance_split.pl coleman.osm 49.6364741 -114.5066995 10
The interpolation value is optional, not setting anything or setting '0' will produced markers at every node along the routable ways. Setting '-1' will only produce markers at junctions and terminus nodes.
Setting a value of '1' or greater will interpolate on the ways and insert nodes so that there is a node at least every every '<value>' meters (approximately, actually does a integer split of way). The interpolation helps GnuPlot produce sensible contours in a sparse data set.
Stage 3: Optionally convert data file to a list of distance markers, do this if you want a distance value placed next to junctions. The 'MARKER.OSM' file can be merged with a map of the area using osmosis. Since the distance value is likely to have many decimal points you may wish to add some rounding function or use a multiplier to change units.
$ awk -f data2node.awk < data.txt > MARKER.OSM
Stage 4: Optionally convert data file into contours using the 'mkcntr2.pl <contour spacing> <mid contours> <major contours>' script (which uses GnuPlot to do the heavy lifting). The 'CONTOUR.OSM' file can be merged with a map of the area using osmosis.
$ mkcntr2.pl data.txt 100 500 2000 > CONTOURS.OSM
Stage 5: Render the map with the renderer of your chosing. As osmarender does not render contours by default, you will have to add a rule to your feature file(s) to make them visible.
<rule e="way" k="contour" v="elevation" layer="5">
  <rule e="way" k="contour_ext" v="elevation_minor" layer="5">
    <line style="stroke-width: 0.5px; stroke-linecap: round; stroke: #3030e0; fill: none'"/>
  </rule>
  <rule e="way" k="contour_ext" v="elevation_medium" layer="5">
    <line style="stroke-width: 0.8px; stroke-linecap: round; stroke: #3030e0; fill: none'"/>
    <pathText k="ele" text-anchor='middle' startOffset='50%' font-family='Bitstream Charter' font-size='6px' fill='#3030e0'/>
  </rule>
  <rule e="way" k="contour_ext" v="elevation_major" layer="5">
    <line style="stroke-width: 1.2px; stroke-linecap: round; stroke: #e03030; fill: none'"/>
    <pathText k="ele" text-anchor='middle' startOffset='50%' font-family='Bitstream Charter' font-size='8px' fill='#e03030'/>
  </rule>
</rule>
Checking routing connectivity of an OSM file

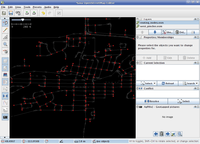
One of the useful side effects of this is code is that it make it quite easy to confirm/check the routability of an OSM file. After computing the distance to all routable nodes, this output data can be loaded into a separate layer in JOSM.
With a quick visual glance you can see where the nodes are connect, and whether all the ways are indeed routable. In the screen capture to the left, there is an unroutable node - follow the central way down, it's about a 1/3 of the way down from the top. In this case the way was not connected to the central way.