Tah-heatmap

tah-heatmap is a very simple renderer that renders a 4096 x 4096 PNG image of the world with each pixel corresponding to one z12 tile. The colour of individual pixels is determined by the size of the Tiles@home z12 tile for that location. Thereby producing a rough heatmap for the globe which gives an indicator of the complexity of OpenStreetMap data as split by z12 tiles.
Full size images
-
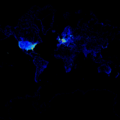 tah-heatmap as of June 2009
 -
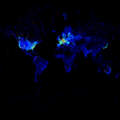 tah-heatmap on 29 April 2011

The latter map shows an intensification and expansion of mapping in the primary mapped regions of Europe and the USA / Canada. Japan has also become an intensively mapped area. The rest of the world becomes much more prominent.
Note that the later image may be misleading; some large areas with area fills (e.g. forested areas) have been added. These areas become more prominent, even though there is little or no other mapping data there. There are also some red markings in unlikely locations, e.g. the Arctic.
Running it
svn co https://svn.openstreetmap.org/applications/rendering/tah-heatmap
Then read the README file for how to run it.