File:Typhoon Haiyan - OSM data growth line graph.png
Jump to navigation
Jump to search
Size of this preview: 800 × 593 pixels. Other resolutions: 320 × 237 pixels | 640 × 474 pixels | 1,024 × 759 pixels | 1,280 × 948 pixels | 1,837 × 1,361 pixels.
Original file (1,837 × 1,361 pixels, file size: 41 KB, MIME type: image/png)
Summary
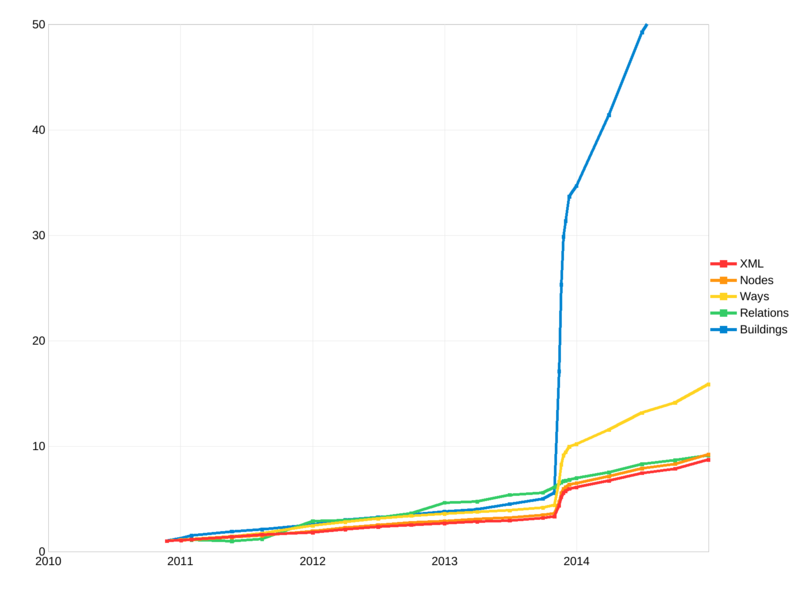
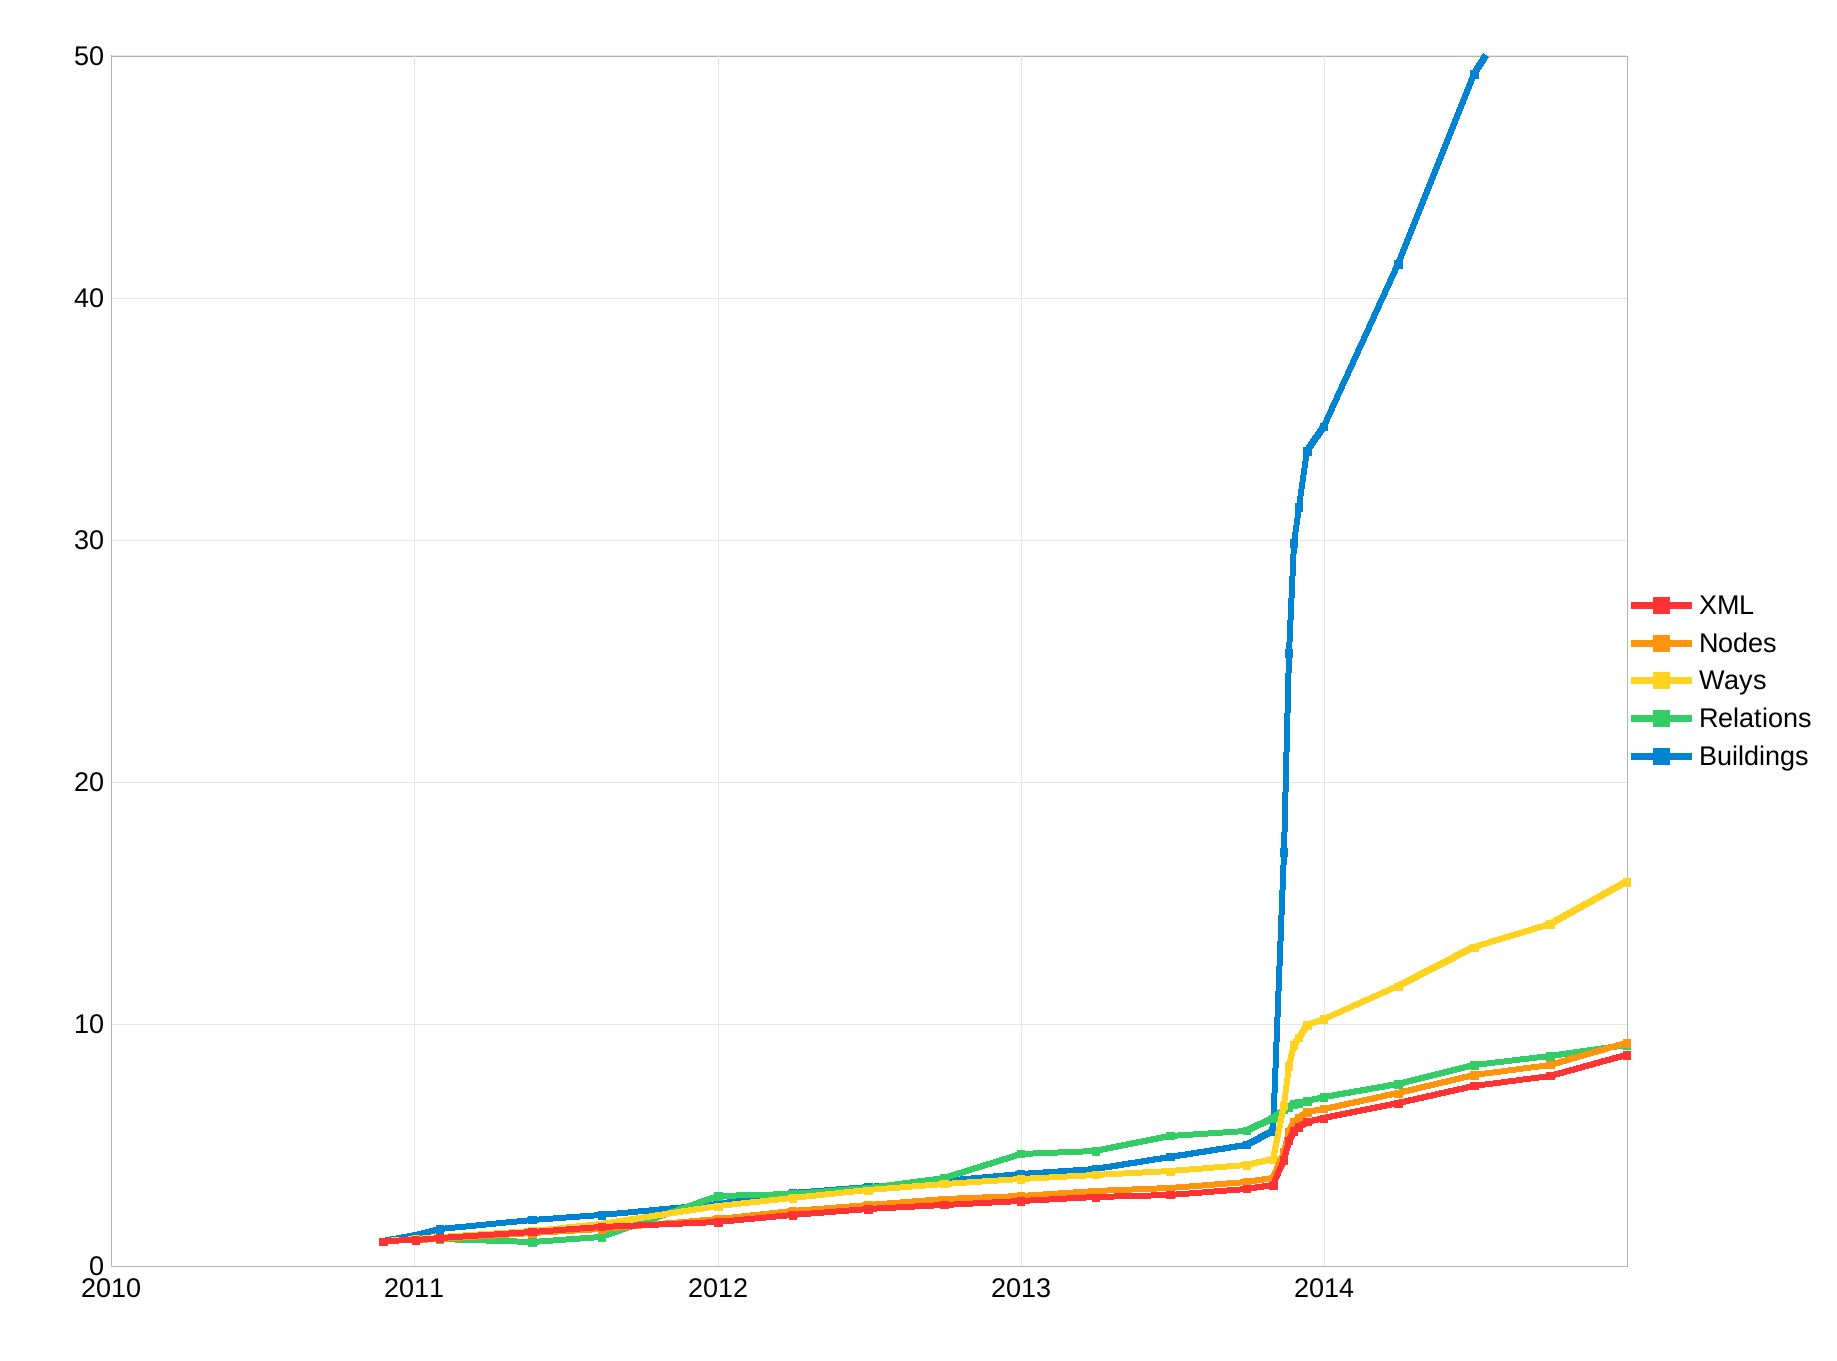
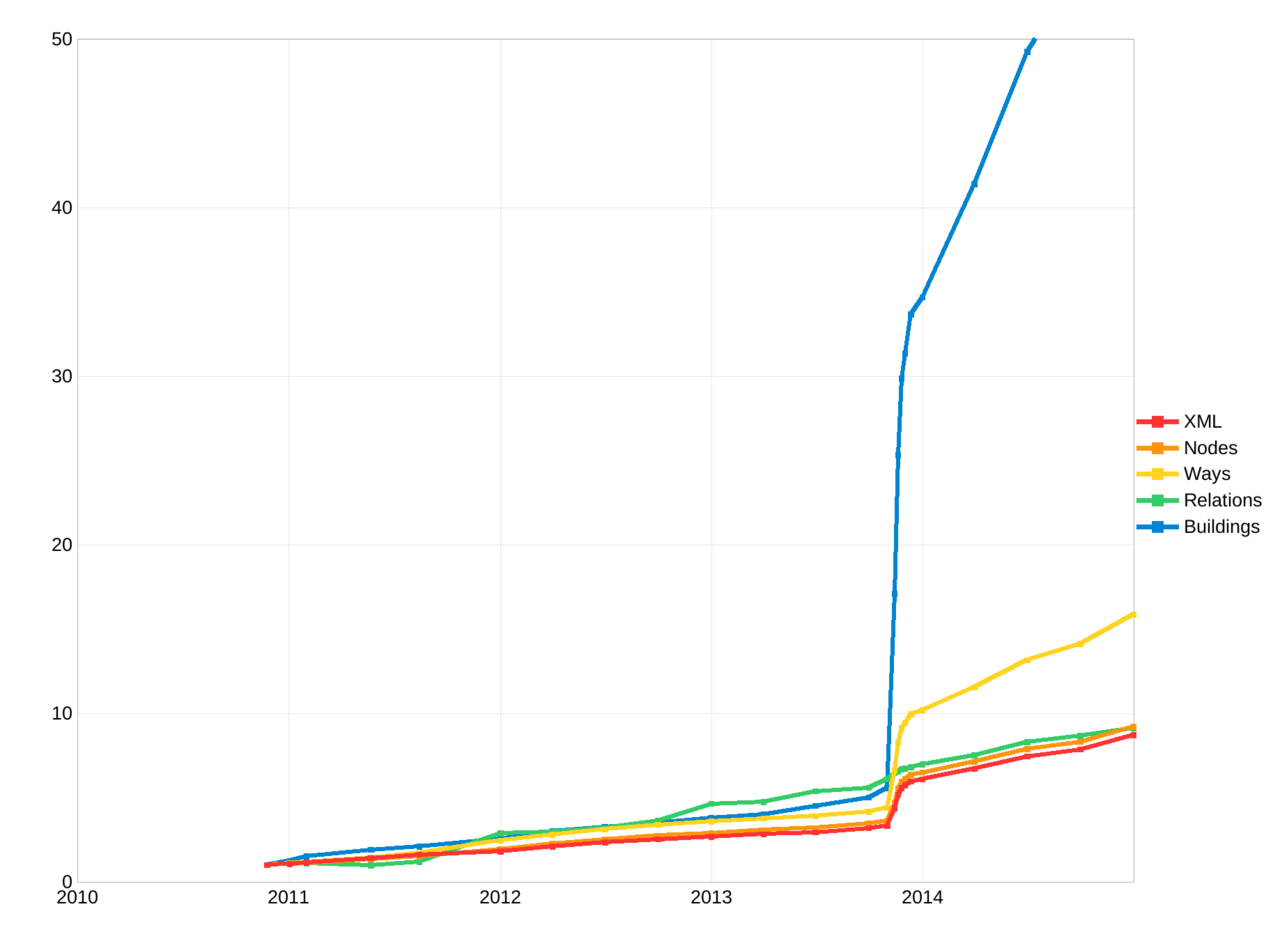
| Description | A line graph showing the extreme spike in the growth of OSM data for the Philippines as a result of mapping for Typhoon Haiyan. |
|---|---|
| Author | Eugene Alvin Villar (seav) |
| Source | |
| Date | 2018-11-08 |
Licensing
![]()
![]()
![]()
This work is licensed under the Creative Commons Attribution-ShareAlike 4.0 License.
Attribution: Eugene Alvin Villar (seav)
Attribution: Eugene Alvin Villar (seav)
File history
Click on a date/time to view the file as it appeared at that time.
| Date/Time | Thumbnail | Dimensions | User | Comment | |
|---|---|---|---|---|---|
| current | 10:45, 8 November 2018 | | 1,837 × 1,361 (41 KB) | Seav (talk | contribs) | {{Information | Description = A line graph showing the extreme spike in the growth of OSM data for the Philippines as a result of mapping for Typhoon Haiyan. | Author = Eugene Alvin Villar (seav) | Date = 2018-11-08 }} |
You cannot overwrite this file.
File usage
The following 4 pages use this file:
- Humanitarian OSM Team/HOT Microgrants/Community Impact Microgrants 2021/Proposal/Quality Assessment (Validation) of OpenStreetMap Data on Post-Disaster Typhoon Response Activation Areas: A Case Study for Tacloban, Leyte
- Humanitarian OSM Team/HOT Microgrants/Humanitarian OpenStreetMap Summit Grant 2020/Proposal/Validation on Post-Disaster Activations
- Typhoon Haiyan
- ES:Typhoon Haiyan