OSM Analytics
Jump to navigation
Jump to search

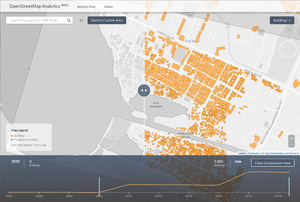
OSM Analytics (osm-analytics.org) was a tool for visualising and analysing mapping progress. Developed by the Humanitarian OpenStreetMap Team and partners with grant funding from the Knight Foundation, the tool was launched in April 2016 with this HOT blog post which explains more.
Features
Basic feature walk-through:
- The tool offers a thematic selection of either "Buildings", "Roads", "Rivers", or "Amenities" data. Select this in the top right
- Search for a town name, or zoom in and select an area to analyse by clicking "Outline custom area" and adjusting the polygon.
- On the timeline graph, zoom in using the mousewheel if you want to focus on a short stretch of time
- On the timeline graph, drag a blue box sideways to highlight a stretch of time. Mapped objects will be highlighted in blue on the map.
- Click "Compare time periods" to swap to comparison view. Drag the central map slider to compare before and after.
- While in comparison view, drag the two vertical bars on the timeline to set the moments in time which represent "before" and "after".
Other features include, swapping to "Editor level of experience" rather than timeline, and showing project areas of OSM Tasking Manager projects.
Development
Source code on github: https://github.com/hotosm/osm-analytics
Implemented with React/Redux (javascript)