ohsomeHeX

HeiGIT • Openrouteservice • Ohsome
Ohsome API • OSHDB • Ohsome Dashboard • OhsomeHeX • Ohsome quality API
| ohsomeHeX | ||||||||||||||||||||
|---|---|---|---|---|---|---|---|---|---|---|---|---|---|---|---|---|---|---|---|---|
| Author: | HeiGIT | |||||||||||||||||||
| Platform: | Web | |||||||||||||||||||
| Version: | 1 | |||||||||||||||||||
| Website: | https://ohsome.org/apps/osm-history-explorer/ | |||||||||||||||||||
| Programming language: | JavaScript
| |||||||||||||||||||
| ||||||||||||||||||||
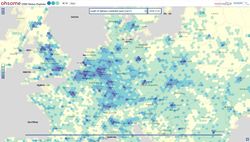
The OpenStreetMap History eXplorer (ohsomeHeX) allows a visual exploration of the history of OSM Data and presents a step to uncover interesting semantic connections, regions of interest and their contiguity in time and space. It is developed by the Big Spatial Data Analytics team at HeiGIT - Heidelberg Institute for Geoinformation Technology.
General Information
In order to decide upon the utilization of OpenStreetMap (OSM) data for a field of interest in a specific region of the world it is of great importance to asses of the quality of OSM data. Therefore the analysis of the evolution of the data is a decidedly sensible approach and allows to derive measures and to develop analytical tools that give insight into the quality of the data. OhsomeHeX allows the spatio-temporal exploration of the OSM data on a global scale. Therefore we use the ohsome OpenStreetMap History Data Analytics Platform to aggregate the data of selected features into a set of world spanning hexagonal grids in a monthly resolution. See latest news on GIScience blog post
What can you do with ohsomeHeX?
- Choose a measure for example Length of highway = primary (way) per country [m/m²]
- You see the result as overlay in a map
- See with a time slider the evolution of these data
- Select hexs/cells on the map to generate datasets, which appears in right-side panel
- Click "Get graph" to see evolution of data over time for the selected region in chart format in the bottom panel
- You can get individual dataset's graph or can request to get merged graph result for the datasets generated. Eg: Comparing Number of Buildings in Berlin with Moscow OR Comparing Number of Hospitals in Heidelberg with Number of Clinics in Heidelberg
- For selected Topics, zooming in more than a threshold will load OSM features involved in generating the selected Topic. Each feature geometry is clickable to get its tag information. More on this is with examples here
- Use time slider to see evolution of these features
For further information check out this blog post.
References
OhsomeHeX resembles the idea of the OSMatrix but improves many of its shortcomings. OSMatrix was developed at the GIScience working group between 2011-2013. For more information see:
- Roick, Oliver; Loos, Lukas; Zipf, Alexander (2012): A Technical Framework for Visualizing Spatio-temporal Quality Metrics of Volunteered Geographic Information. Geoinformatik 2012, Braunschweig, March 2012.
- Roick, Oliver; Hagenauer, Julian; Zipf, Alexander (2011): OSMatrix — Grid based analysis and visualization of OpenStreetMap. State of the Map EU. Vienna, July 2011.
