Editor usage stats
Usage statistics of OSM editors here …
Info about this page
Note that most plots on this page include at least one logarithmic scale. This may be unfamiliar to some readers (seeing usually linear scales).
Remark on updates. It will occasionally be updated, but I cannot promise to maintain regular intervals. If you think another update is past due, please remind me. See this page's history for the last update.
This page has been thoroughly redesigned in mid-2012. If you are looking for the older raw statistics, check the archive page.
The "market share" of an OSM editor can be defined using different weights: the number of changesets created, the number of its users, or the number of edits actually made, and various others (including combinations of the former). Each definition has its advantages and disadvantages, but each also tells something about how a given editor is (or was) used.
In the tables below, the market shares of various editors according to the aforementioned three definitions are presented, broken up into years. For the corresponding plots, the time resolution is six months.
Methodology
If you are not interested in technical details, feel free to skip this section.
All the information presented on this page is extracted from changesets-yymmdd.osm.bz2 files. An editor is identified by the created_by tag of each changeset. (This implies that 2009 data cover only the time following the startup of API 0.6, when changesets – and changeset metadata – were introduced, and that statistics for earlier years cannot be generated in this simple way.)
In all the tables, 2025 means "2025 so far". For obvious reasons, full-year statistics cannot yet be generated.
The tables and plots show, respectively, the number of changesets created using an editor (a simple counting exercise in processing the changesets file), the number of total edits made with it (computed by summing up the num_changes of each changeset), and the number of distinct user IDs (uids) seen in association with each editor. The latter is assumed to correspond to the number of actual users/mappers (though some may use more than one account, which is not considered here). The data are resolved by years for the tables and by half years for the plots. Market shares (as percentages) are calculated with respect to the overall sums.
In the "distinct uids" table, mappers editing with more than one editor will be counted once for each editor. This double-counting implies that the sum of all is not equal to the total number of mappers editing in a given period of time. The "market shares" in the corresponding plot are, however, calculated in relation to that number. Therefore, the market shares do not add up to one; instead, their interpretation is as follows: if an editor has, say, a market share of 0.5 in a given period of time, 50% of all mappers have used that particular editor at least once in that period - but some of them may have used other editors as well. For example, in the first half of 2012, Potlatch 2 and JOSM had respective market shares of roughly 85% and 36%, the sum of which already largely exceeds 100%.
The double-counting of users could in principle be remedied by "splitting" users according to some sort of weight, for example, the number of changesets created with each editor, but that would alter the definition and distort the distribution, diluting the desired information about the user basis. Therefore, such is not done here.
Observations
These are some conclusions to be drawn from the numbers below. The list is by no means exclusive.
- It is obvious that according to the number of edits, JOSM has never been challenged as the number one editor (the only nominal exception in 2009 being a special case, when huge numbers of superfluous tags from the TIGER import were removed by woodpeck_fixbot using osmtools, and with changesets from before API 0.6 that can not be associated with any editor). JOSM's dominance is not so clear in terms of changesets created - this has to do with Potlatch 1 creating zillions of empty changesets in live editing mode, but also with the fact that Potlatch users tend to make smaller changesets on average, and iD users creating even smaller changesets than Potlatch 2 users.
- Also, the common notion that the main online editors on the OSM website reach the largest number of users, is confirmed; with that role initially held by Potlatch 1, then Potlatch 2 and then iD. In fact, the number of actual edits made with Potlatch 1 has gradually decreased with increasing popularity of Potlatch 2, dropping to the permille level in 2012. Largely the same process has happened when iD went live, though the number of changes and contributors using Potlatch 2 remained higher for a longer time.
- It turns out that Merkaartor, which was often regarded as one of the "big three" editors and seen as a serious competitor to JOSM, did not really fill that role. Merkaartor's market share has never exceeded 2 percent in terms of edits and 5 percent in terms of changesets; its user base has at no time been comparable to that of JOSM and has been continuously declining for years. This may be related to the editor's stalled development.
- Most other editors have never reached percent-level market shares (the exceptions being import scripts, used by only few users but editing large amounts of data).
- Recently, several smartphone applications have obtained a non-negligible audience (making very few actual edits per changesets, which of course reflects their goal of filling the niche for quickly editing, like entering the opening hours of some POI). These include StreetComplete, Go Map!!, Vespucci, Pushpin, POI+, and the navigation tools OsmAnd, MAPS.ME, Organic Maps.
- Another mobile application takes a somewhat surprising position in the tables: MapStalt Mini by Microsoft. Quickly dumped onto the market in 2011 (not even able to write proper created_by tag, and unmaintained since the first release), MapStalt has for several years reached more users than most other mobile editors. The numbers of changesets and edits made by these users are, however, negligible; most users seem to only have tried the program once. But even the large number of (one-time) users is surprising, as the target system Windows Phone has never reached serious market shares, and one would hardly expect an above-average interest in a free/open/crowdsourced project from users of Microsoft's products.
- JOSM's (relative) market share in terms of users has continually decreased over the past years (unlike its market shares by changesets and edits, which have remained roughly constant). The total number of all mappers has grown, but the number of JOSM users seems to have saturated. In other words: a growing percentage of users has been using exclusively one of the online editors and not been converted to JOSM users.
- Considering the user statistics, one should keep in mind that these are fully unbiased counts. Every mapper who has made at least one changeset with an editor is counted as a user of that editor. Therefore the analysis distinguishes neither between one-time and regular mappers nor between main and secondary/auxiliary editors.
Tables and figures
These tables were generated automatically with wiki.pl from the changeset dump of 2025-07-07. Numbers for 2025 are obviously not final.
by number of users (distinct uids)
| editor | 2009 | 2010 | 2011 | 2012 | 2013 | 2014 | 2015 | 2016 | 2017 | 2018 | 2019 | 2020 | 2021 | 2022 | 2023 | 2024 | 2025 |
|---|---|---|---|---|---|---|---|---|---|---|---|---|---|---|---|---|---|
| iD | - | - | - | - | 56 176 (43.6%) | 125 149 (80.1%) | 133 826 (81.8%) | 148 470 (56.7%) | 194 572 (61.0%) | 214 073 (69.5%) | 203 449 (72.2%) | 241 205 (79.7%) | 239 539 (81.9%) | 204 580 (79.1%) | 210 139 (76.8%) | 205 427 (78.0%) | 126 412 (76.9%) |
| StreetComplete | - | - | - | - | - | - | - | 7 (~0%) | 9 572 (3.0%) | 9 764 (3.2%) | 8 966 (3.2%) | 11 695 (3.9%) | 21 935 (7.5%) | 23 525 (9.1%) | 26 809 (9.8%) | 27 111 (10.3%) | 20 033 (12.2%) |
| JOSM | 13 753 (18.8%) | 18 794 (23.6%) | 20 210 (21.2%) | 23 415 (19.0%) | 23 106 (17.9%) | 21 830 (14.0%) | 22 759 (13.9%) | 22 311 (8.5%) | 23 190 (7.3%) | 22 762 (7.4%) | 22 767 (8.1%) | 22 028 (7.3%) | 21 397 (7.3%) | 20 438 (7.9%) | 19 636 (7.2%) | 18 056 (6.9%) | 12 405 (7.5%) |
| Organic Maps | - | - | - | - | - | - | - | - | - | - | - | - | 3 017 (1.0%) | 6 258 (2.4%) | 10 557 (3.9%) | 12 765 (4.8%) | 10 961 (6.7%) |
| OsmAnd | - | 192 (0.2%) | 645 (0.7%) | 1 129 (0.9%) | 1 653 (1.3%) | 1 927 (1.2%) | 2 354 (1.4%) | 3 538 (1.4%) | 4 862 (1.5%) | 5 982 (1.9%) | 7 063 (2.5%) | 6 977 (2.3%) | 7 959 (2.7%) | 8 623 (3.3%) | 8 545 (3.1%) | 7 875 (3.0%) | 4 794 (2.9%) |
| Vespucci | 58 (0.08%) | 237 (0.3%) | 460 (0.5%) | 957 (0.8%) | 1 622 (1.3%) | 1 801 (1.2%) | 2 075 (1.3%) | 2 379 (0.9%) | 2 920 (0.9%) | 3 332 (1.1%) | 3 632 (1.3%) | 4 314 (1.4%) | 4 539 (1.6%) | 5 025 (1.9%) | 5 371 (2.0%) | 5 322 (2.0%) | 3 542 (2.2%) |
| Rapid | - | - | - | - | - | - | - | - | - | - | 1 105 (0.4%) | 3 709 (1.2%) | 2 124 (0.7%) | 2 183 (0.8%) | 9 121 (3.3%) | 3 662 (1.4%) | 3 077 (1.9%) |
| Every Door | - | - | - | - | - | - | - | - | - | - | - | - | - | 1 992 (0.8%) | 3 675 (1.3%) | 4 324 (1.6%) | 3 064 (1.9%) |
| Go Map!! | - | - | - | - | 2 205 (1.7%) | 2 046 (1.3%) | 1 335 (0.8%) | 1 508 (0.6%) | 1 834 (0.6%) | 2 687 (0.9%) | 3 096 (1.1%) | 3 174 (1.0%) | 3 762 (1.3%) | 3 731 (1.4%) | 3 844 (1.4%) | 4 163 (1.6%) | 2 937 (1.8%) |
| MAPS.ME | - | - | - | - | - | - | - | 96 584 (36.9%) | 102 375 (32.1%) | 71 199 (23.1%) | 55 719 (19.8%) | 35 483 (11.7%) | 19 974 (6.8%) | 15 515 (6.0%) | 16 231 (5.9%) | 7 729 (2.9%) | 2 284 (1.4%) |
| StreetComplete EE | - | - | - | - | - | - | - | - | - | - | - | - | - | 414 (0.16%) | 1 977 (0.7%) | 2 606 (1.0%) | 1 957 (1.2%) |
| OpenAEDMap | - | - | - | - | - | - | - | - | - | - | - | - | - | 88 (0.03%) | 332 (0.12%) | 1 244 (0.5%) | 1 440 (0.9%) |
| MapComplete | - | - | - | - | - | - | - | - | - | - | - | 353 (0.12%) | 718 (0.2%) | 1 250 (0.5%) | 1 410 (0.5%) | 1 545 (0.6%) | 1 208 (0.7%) |
| JOSM Reverter | - | 3 (~0%) | 715 (0.8%) | 862 (0.7%) | 923 (0.7%) | 1 001 (0.6%) | 1 032 (0.6%) | 231 (0.09%) | 5 (~0%) | 3 (~0%) | 941 (0.3%) | 1 418 (0.5%) | 1 548 (0.5%) | 1 380 (0.5%) | 1 325 (0.5%) | 1 144 (0.4%) | 769 (0.5%) |
| CoMaps | - | - | - | - | - | - | - | - | - | - | - | - | - | - | - | - | 627 (0.4%) |
| osm-revert | - | - | - | - | - | - | - | - | - | - | - | - | - | - | 462 (0.17%) | 825 (0.3%) | 593 (0.4%) |
| OsmHydrant | - | - | - | - | 1 (~0%) | 344 (0.2%) | 665 (0.4%) | 751 (0.3%) | 866 (0.3%) | 934 (0.3%) | 1 166 (0.4%) | 1 409 (0.5%) | 1 386 (0.5%) | 1 456 (0.6%) | 1 589 (0.6%) | 1 100 (0.4%) | 461 (0.3%) |
| GNOME Maps | - | - | - | - | - | - | 2 (~0%) | 247 (0.09%) | 421 (0.13%) | 472 (0.15%) | 556 (0.2%) | 766 (0.3%) | 588 (0.2%) | 475 (0.18%) | 424 (0.15%) | 575 (0.2%) | 425 (0.3%) |
| Osm Go! | - | - | - | - | - | - | - | 2 (~0%) | 2 (~0%) | 46 (0.01%) | 194 (0.07%) | 346 (0.11%) | 695 (0.2%) | 580 (0.2%) | 539 (0.2%) | 587 (0.2%) | 294 (0.18%) |
| Level0 | - | - | - | - | - | 109 (0.07%) | 174 (0.11%) | 205 (0.08%) | 222 (0.07%) | 233 (0.08%) | 252 (0.09%) | 290 (0.10%) | 266 (0.09%) | 320 (0.12%) | 338 (0.12%) | 342 (0.13%) | 252 (0.15%) |
| OpenStop | - | - | - | - | - | - | - | - | - | - | - | - | - | 45 (0.02%) | 337 (0.12%) | 424 (0.16%) | 238 (0.14%) |
| Osmose Editor | - | - | - | - | - | 157 (0.10%) | 224 (0.14%) | 249 (0.10%) | 284 (0.09%) | 275 (0.09%) | 377 (0.13%) | 444 (0.15%) | 377 (0.13%) | 293 (0.11%) | 333 (0.12%) | 313 (0.12%) | 202 (0.12%) |
| RevertUI | - | - | - | - | - | - | - | 23 (0.01%) | 58 (0.02%) | 76 (0.02%) | 83 (0.03%) | 189 (0.06%) | 254 (0.09%) | 322 (0.12%) | 382 (0.14%) | 302 (0.11%) | 189 (0.12%) |
| IsraelHiking | - | - | - | - | - | - | - | - | 88 (0.03%) | 131 (0.04%) | 153 (0.05%) | 303 (0.10%) | 359 (0.12%) | 301 (0.12%) | 243 (0.09%) | 235 (0.09%) | 150 (0.09%) |
| OSM ↔ Wikidata | - | - | - | - | - | - | - | - | 66 (0.02%) | 82 (0.03%) | 160 (0.06%) | 113 (0.04%) | 108 (0.04%) | 107 (0.04%) | 189 (0.07%) | 229 (0.09%) | 143 (0.09%) |
| OsmInEdit | - | - | - | - | - | - | - | - | - | - | 77 (0.03%) | 172 (0.06%) | 172 (0.06%) | 170 (0.07%) | 186 (0.07%) | 169 (0.06%) | 114 (0.07%) |
| MapRoulette | - | - | - | - | - | - | - | - | - | - | 41 (0.01%) | 77 (0.03%) | 131 (0.04%) | 323 (0.12%) | 251 (0.09%) | 180 (0.07%) | 95 (0.06%) |
| Potlatch 3 | - | - | - | - | - | - | - | - | - | - | - | 29 (0.01%) | 516 (0.18%) | 350 (0.14%) | 234 (0.09%) | 147 (0.06%) | 76 (0.05%) |
| Pic4Review | - | - | - | - | - | - | - | - | - | 250 (0.08%) | 517 (0.18%) | 456 (0.15%) | 443 (0.15%) | 480 (0.19%) | 310 (0.11%) | 210 (0.08%) | 72 (0.04%) |
| OSMyBiz | - | - | - | - | - | - | - | - | - | 6 (~0%) | 109 (0.04%) | 109 (0.04%) | 97 (0.03%) | 70 (0.03%) | 83 (0.03%) | 102 (0.04%) | 49 (0.03%) |
| Merkaartor | 2 262 (3.1%) | 2 784 (3.5%) | 2 193 (2.3%) | 1 687 (1.4%) | 1 090 (0.8%) | 597 (0.4%) | 456 (0.3%) | 409 (0.16%) | 332 (0.10%) | 256 (0.08%) | 241 (0.09%) | 264 (0.09%) | 219 (0.07%) | 185 (0.07%) | 148 (0.05%) | 114 (0.04%) | 45 (0.03%) |
| osmapi | - | - | - | - | - | 42 (0.03%) | 48 (0.03%) | 72 (0.03%) | 69 (0.02%) | 67 (0.02%) | 47 (0.02%) | 69 (0.02%) | 37 (0.01%) | 47 (0.02%) | 57 (0.02%) | 42 (0.02%) | 23 (0.01%) |
| osmtools | 61 (0.08%) | 108 (0.14%) | 53 (0.06%) | 42 (0.03%) | 32 (0.02%) | 30 (0.02%) | 28 (0.02%) | 34 (0.01%) | 36 (0.01%) | 25 (0.01%) | 23 (0.01%) | 17 (0.01%) | 17 (0.01%) | 20 (0.01%) | 20 (0.01%) | 14 (0.01%) | 9 (0.01%) |
| Potlatch 2 | - | 3 787 (4.8%) | 66 586 (69.9%) | 101 941 (82.5%) | 72 649 (56.4%) | 29 358 (18.8%) | 24 045 (14.7%) | 14 694 (5.6%) | 10 021 (3.1%) | 6 451 (2.1%) | 4 912 (1.7%) | 3 425 (1.1%) | 163 (0.06%) | - | - | - | - |
| Potlatch 0.x/1.x | 59 540 (81.3%) | 68 273 (85.7%) | 26 327 (27.6%) | 13 033 (10.5%) | 745 (0.6%) | 517 (0.3%) | 429 (0.3%) | 382 (0.15%) | 272 (0.09%) | 233 (0.08%) | 199 (0.07%) | 154 (0.05%) | 5 (~0%) | - | - | - | - |
| rosemary | - | 266 (0.3%) | 1 137 (1.2%) | 1 051 (0.9%) | 1 532 (1.2%) | 1 723 (1.1%) | 2 761 (1.7%) | 2 487 (0.9%) | 2 345 (0.7%) | 1 990 (0.6%) | 72 (0.03%) | 33 (0.01%) | 13 (~0%) | 7 (~0%) | 3 (~0%) | - | - |
| Map builder | - | - | - | - | - | - | - | - | - | - | - | - | 1 (~0%) | 1 506 (0.6%) | 1 722 (0.6%) | 6 333 (2.4%) | - |
| Mapzen | 806 (1.1%) | 3 436 (4.3%) | 2 208 (2.3%) | 232 (0.19%) | 102 (0.08%) | 67 (0.04%) | 9 (0.01%) | 4 (~0%) | 3 (~0%) | 2 (~0%) | - | - | - | - | - | - | - |
| MapStalt Mini | - | - | 577 (0.6%) | 1 183 (1.0%) | 1 851 (1.4%) | 378 (0.2%) | 47 (0.03%) | - | - | - | - | - | - | - | - | - | - |
| Pushpin | - | - | - | 389 (0.3%) | 998 (0.8%) | 1 113 (0.7%) | 780 (0.5%) | 461 (0.18%) | 230 (0.07%) | 15 (~0%) | - | - | - | - | - | - | - |
| OpenMaps | - | 610 (0.8%) | 682 (0.7%) | 977 (0.8%) | 386 (0.3%) | 232 (0.15%) | 182 (0.11%) | 99 (0.04%) | 28 (0.01%) | - | - | - | - | - | - | - | - |
| OSMPOIEditor | - | - | - | 336 (0.3%) | 571 (0.4%) | 623 (0.4%) | 378 (0.2%) | 70 (0.03%) | 26 (0.01%) | 2 (~0%) | - | - | - | - | - | - | - |
| MapContrib | - | - | - | - | - | - | 3 (~0%) | 97 (0.04%) | 243 (0.08%) | 243 (0.08%) | 314 (0.11%) | 401 (0.13%) | 143 (0.05%) | 155 (0.06%) | 124 (0.05%) | 19 (0.01%) | - |
| OSM Contributor | - | - | - | - | - | - | - | - | 198 (0.06%) | 424 (0.14%) | 443 (0.16%) | 289 (0.10%) | 177 (0.06%) | 56 (0.02%) | 23 (0.01%) | 6 (~0%) | - |
| iLOE | 131 (0.18%) | 327 (0.4%) | 332 (0.3%) | 343 (0.3%) | 141 (0.11%) | 51 (0.03%) | 4 (~0%) | 1 (~0%) | - | - | - | - | - | - | - | - | - |
| FireYak | - | - | - | - | - | - | - | 21 (0.01%) | 131 (0.04%) | 158 (0.05%) | 221 (0.08%) | 251 (0.08%) | 214 (0.07%) | 172 (0.07%) | 109 (0.04%) | 43 (0.02%) | - |
| RawEdit | 93 (0.13%) | 75 (0.09%) | 100 (0.11%) | 181 (0.15%) | 147 (0.11%) | 129 (0.08%) | 122 (0.07%) | 161 (0.06%) | 148 (0.05%) | 63 (0.02%) | - | - | - | - | - | - | - |
| ArcGIS | - | 45 (0.06%) | 107 (0.11%) | 101 (0.08%) | 61 (0.05%) | 67 (0.04%) | 67 (0.04%) | 156 (0.06%) | 87 (0.03%) | 41 (0.01%) | 40 (0.01%) | 39 (0.01%) | 24 (0.01%) | 23 (0.01%) | 17 (0.01%) | 6 (~0%) | - |
| Mapa AED | - | - | - | - | - | - | - | - | - | - | - | - | - | 318 (0.12%) | 283 (0.10%) | 38 (0.01%) | - |
| QGIS | 31 (0.04%) | 157 (0.2%) | 121 (0.13%) | 159 (0.13%) | 112 (0.09%) | 16 (0.01%) | - | - | 1 (~0%) | - | - | - | - | - | - | - | - |
| BigTinCan | 170 (0.2%) | 187 (0.2%) | 101 (0.11%) | 86 (0.07%) | 12 (0.01%) | - | - | - | - | - | - | - | - | - | - | - | - |
| OSMapTuner | - | - | - | 242 (0.2%) | 178 (0.14%) | 66 (0.04%) | 41 (0.03%) | - | - | - | - | - | - | - | - | - | - |
| Other | 421 (0.6%) | 738 (0.9%) | 558 (0.6%) | 1 286 (1.0%) | 592 (0.5%) | 513 (0.3%) | 764 (0.5%) | 600 (0.2%) | 717 (0.2%) | 948 (0.3%) | 764 (0.3%) | 899 (0.3%) | 812 (0.3%) | 853 (0.3%) | 760 (0.3%) | 868 (0.3%) | 716 (0.4%) |
| Not Specified | 18 623 (25.4%) | 882 (1.1%) | 539 (0.6%) | 443 (0.4%) | 269 (0.2%) | 424 (0.3%) | 704 (0.4%) | 1 586 (0.6%) | 1 404 (0.4%) | 1 182 (0.4%) | 1 067 (0.4%) | 945 (0.3%) | 758 (0.3%) | 128 (0.05%) | 79 (0.03%) | 123 (0.05%) | 15 (0.01%) |
Note that for a user to be counted as a user of any particular editor, a single changeset is sufficient.
So, this metric is mostly only meaningful to show how popular or well-known an editor is, not by how much work gets done with it.

by number of edits
| editor | 2009 | 2010 | 2011 | 2012 | 2013 | 2014 | 2015 | 2016 | 2017 | 2018 | 2019 | 2020 | 2021 | 2022 | 2023 | 2024 | 2025 |
|---|---|---|---|---|---|---|---|---|---|---|---|---|---|---|---|---|---|
| JOSM | 125 615 526 (20.8%) | 494 458 142 (77.4%) | 535 571 793 (80.0%) | 538 991 252 (73.5%) | 497 722 412 (70.7%) | 662 069 355 (76.2%) | 638 906 360 (73.9%) | 624 851 125 (70.8%) | 664 025 865 (67.1%) | 794 007 605 (68.4%) | 788 357 489 (63.9%) | 990 855 817 (63.6%) | 910 154 197 (59.1%) | 754 127 036 (58.6%) | 749 521 891 (56.4%) | 765 096 845 (59.1%) | 398 139 664 (58.6%) |
| iD | - | - | - | - | 34 430 862 (4.9%) | 109 275 830 (12.6%) | 142 199 332 (16.5%) | 189 401 329 (21.5%) | 279 192 774 (28.2%) | 321 496 138 (27.7%) | 359 714 471 (29.2%) | 459 876 980 (29.5%) | 480 371 322 (31.2%) | 416 748 397 (32.4%) | 427 973 880 (32.2%) | 428 165 638 (33.1%) | 232 199 772 (34.2%) |
| Rapid | - | - | - | - | - | - | - | - | - | - | 11 678 103 (0.9%) | 51 870 526 (3.3%) | 63 919 308 (4.2%) | 63 564 994 (4.9%) | 63 683 830 (4.8%) | 52 467 053 (4.1%) | 23 364 110 (3.4%) |
| Vespucci | 2 087 (~0%) | 22 298 (~0%) | 49 455 (0.01%) | 165 722 (0.02%) | 277 566 (0.04%) | 804 178 (0.09%) | 885 787 (0.10%) | 1 055 056 (0.12%) | 1 559 094 (0.16%) | 2 073 140 (0.18%) | 2 296 702 (0.19%) | 3 564 289 (0.2%) | 3 517 790 (0.2%) | 3 864 897 (0.3%) | 4 998 546 (0.4%) | 9 855 980 (0.8%) | 6 713 424 (1.0%) |
| StreetComplete | - | - | - | - | - | - | - | 85 (~0%) | 1 256 558 (0.13%) | 1 700 816 (0.15%) | 1 983 671 (0.16%) | 3 934 118 (0.3%) | 12 439 388 (0.8%) | 12 904 369 (1.0%) | 13 630 403 (1.0%) | 12 782 820 (1.0%) | 5 886 094 (0.9%) |
| Go Map!! | - | - | - | - | 501 785 (0.07%) | 632 666 (0.07%) | 976 605 (0.11%) | 891 117 (0.10%) | 1 141 922 (0.12%) | 2 535 539 (0.2%) | 3 782 685 (0.3%) | 5 005 007 (0.3%) | 4 758 358 (0.3%) | 4 405 116 (0.3%) | 4 270 044 (0.3%) | 4 443 642 (0.3%) | 2 623 231 (0.4%) |
| StreetComplete EE | - | - | - | - | - | - | - | - | - | - | - | - | - | 83 493 (0.01%) | 1 174 799 (0.09%) | 2 695 077 (0.2%) | 1 743 899 (0.3%) |
| Potlatch 3 | - | - | - | - | - | - | - | - | - | - | - | 122 079 (0.01%) | 4 863 277 (0.3%) | 2 678 828 (0.2%) | 2 574 667 (0.2%) | 2 766 754 (0.2%) | 1 436 729 (0.2%) |
| osm-revert | - | - | - | - | - | - | - | - | - | - | - | - | - | - | 14 476 276 (1.1%) | 2 208 477 (0.17%) | 1 394 756 (0.2%) |
| JOSM Reverter | - | 137 (~0%) | 3 555 152 (0.5%) | 3 135 252 (0.4%) | 2 296 205 (0.3%) | 4 644 756 (0.5%) | 3 787 772 (0.4%) | 591 442 (0.07%) | 147 328 (0.01%) | 1 118 (~0%) | 2 352 172 (0.2%) | 5 215 660 (0.3%) | 7 326 764 (0.5%) | 4 432 963 (0.3%) | 7 237 814 (0.5%) | 2 038 513 (0.16%) | 1 310 919 (0.2%) |
| osmtools | 150 412 240 (24.9%) | 8 994 328 (1.4%) | 981 921 (0.15%) | 1 229 689 (0.17%) | 2 734 257 (0.4%) | 1 499 370 (0.17%) | 6 826 400 (0.8%) | 15 035 558 (1.7%) | 2 655 505 (0.3%) | 3 271 989 (0.3%) | 7 558 536 (0.6%) | 6 454 470 (0.4%) | 8 152 531 (0.5%) | 12 399 003 (1.0%) | 29 128 241 (2.2%) | 2 154 313 (0.17%) | 1 189 418 (0.18%) |
| upload.py | 31 074 573 (5.1%) | 10 166 002 (1.6%) | 2 414 205 (0.4%) | 421 238 (0.06%) | 776 590 (0.11%) | 429 871 (0.05%) | 488 194 (0.06%) | 4 827 (~0%) | 38 997 (~0%) | 3 021 (~0%) | 4 195 (~0%) | 1 853 644 (0.12%) | 4 378 760 (0.3%) | 822 536 (0.06%) | 968 637 (0.07%) | 2 536 270 (0.2%) | 704 903 (0.10%) |
| Every Door | - | - | - | - | - | - | - | - | - | - | - | - | - | 299 698 (0.02%) | 707 179 (0.05%) | 877 360 (0.07%) | 500 043 (0.07%) |
| MapComplete | - | - | - | - | - | - | - | - | - | - | - | 6 209 (~0%) | 52 676 (~0%) | 949 795 (0.07%) | 860 297 (0.06%) | 1 054 430 (0.08%) | 444 375 (0.07%) |
| osmapi | - | - | - | - | - | 797 190 (0.09%) | 139 521 (0.02%) | 682 193 (0.08%) | 288 536 (0.03%) | 240 521 (0.02%) | 162 462 (0.01%) | 2 095 215 (0.13%) | 890 472 (0.06%) | 1 860 546 (0.14%) | 1 030 357 (0.08%) | 1 094 764 (0.08%) | 235 354 (0.03%) |
| Level0 | - | - | - | - | - | 25 528 (~0%) | 113 023 (0.01%) | 146 327 (0.02%) | 188 651 (0.02%) | 320 786 (0.03%) | 206 785 (0.02%) | 233 316 (0.01%) | 237 719 (0.02%) | 373 908 (0.03%) | 294 926 (0.02%) | 336 536 (0.03%) | 182 013 (0.03%) |
| LINZ Import | - | - | - | - | - | - | - | - | - | - | - | - | 940 738 (0.06%) | 178 965 (0.01%) | 288 388 (0.02%) | 277 839 (0.02%) | 172 889 (0.03%) |
| Merkaartor | 5 378 663 (0.9%) | 10 887 187 (1.7%) | 10 250 026 (1.5%) | 9 702 870 (1.3%) | 4 380 406 (0.6%) | 3 791 724 (0.4%) | 3 696 590 (0.4%) | 2 522 894 (0.3%) | 1 735 350 (0.18%) | 2 138 115 (0.18%) | 2 316 287 (0.19%) | 1 745 000 (0.11%) | 334 114 (0.02%) | 491 775 (0.04%) | 123 828 (0.01%) | 96 656 (0.01%) | 156 789 (0.02%) |
| Organic Maps | - | - | - | - | - | - | - | - | - | - | - | - | 32 911 (~0%) | 115 220 (0.01%) | 143 570 (0.01%) | 178 015 (0.01%) | 105 767 (0.02%) |
| OsmAnd | - | 4 726 (~0%) | 11 576 (~0%) | 22 532 (~0%) | 36 647 (0.01%) | 56 023 (0.01%) | 72 002 (0.01%) | 113 397 (0.01%) | 151 873 (0.02%) | 204 448 (0.02%) | 251 119 (0.02%) | 245 872 (0.02%) | 263 302 (0.02%) | 320 702 (0.02%) | 252 726 (0.02%) | 210 077 (0.02%) | 97 389 (0.01%) |
| OSM ↔ Wikidata | - | - | - | - | - | - | - | - | 83 998 (0.01%) | 95 677 (0.01%) | 114 685 (0.01%) | 231 241 (0.01%) | 105 159 (0.01%) | 61 907 (~0%) | 126 637 (0.01%) | 171 325 (0.01%) | 63 422 (0.01%) |
| AutoAWS | - | - | - | - | - | - | - | - | - | 2 674 602 (0.2%) | 76 127 (0.01%) | 178 939 (0.01%) | 133 574 (0.01%) | 2 635 334 (0.2%) | 87 343 (0.01%) | 66 735 (0.01%) | 55 662 (0.01%) |
| OsmInEdit | - | - | - | - | - | - | - | - | - | - | 33 297 (~0%) | 51 125 (~0%) | 146 744 (0.01%) | 90 737 (0.01%) | 162 561 (0.01%) | 106 842 (0.01%) | 54 032 (0.01%) |
| Osmose Editor | - | - | - | - | - | 20 371 (~0%) | 50 115 (0.01%) | 67 917 (0.01%) | 124 560 (0.01%) | 70 201 (0.01%) | 152 085 (0.01%) | 232 896 (0.01%) | 124 253 (0.01%) | 127 328 (0.01%) | 106 488 (0.01%) | 50 261 (~0%) | 24 173 (~0%) |
| OsmHydrant | - | - | - | - | 21 (~0%) | 19 935 (~0%) | 49 350 (0.01%) | 43 986 (~0%) | 51 439 (0.01%) | 51 988 (~0%) | 58 993 (~0%) | 81 622 (0.01%) | 65 983 (~0%) | 64 653 (0.01%) | 59 224 (~0%) | 42 327 (~0%) | 18 506 (~0%) |
| Osm Go! | - | - | - | - | - | - | - | 838 (~0%) | 1 136 (~0%) | 6 203 (~0%) | 19 973 (~0%) | 27 519 (~0%) | 44 713 (~0%) | 186 849 (0.01%) | 50 670 (~0%) | 35 478 (~0%) | 15 887 (~0%) |
| HTTPS All The Things | - | - | - | - | - | - | - | - | - | - | 492 096 (0.04%) | 11 218 (~0%) | 10 430 (~0%) | 62 062 (~0%) | 365 444 (0.03%) | 76 678 (0.01%) | 14 442 (~0%) |
| MAPS.ME | - | - | - | - | - | - | - | 812 010 (0.09%) | 1 033 627 (0.10%) | 714 216 (0.06%) | 613 554 (0.05%) | 348 812 (0.02%) | 201 795 (0.01%) | 96 002 (0.01%) | 115 484 (0.01%) | 42 820 (~0%) | 13 759 (~0%) |
| Potlatch 2 | - | 7 584 901 (1.2%) | 92 203 498 (13.8%) | 146 236 064 (20.0%) | 133 374 376 (18.9%) | 77 895 566 (9.0%) | 60 077 122 (7.0%) | 42 908 801 (4.9%) | 33 220 441 (3.4%) | 25 135 503 (2.2%) | 20 583 332 (1.7%) | 17 229 989 (1.1%) | 219 840 (0.01%) | - | - | - | - |
| bulk_upload.py | 64 669 041 (10.7%) | 24 649 625 (3.9%) | 1 442 184 (0.2%) | 759 090 (0.10%) | 185 033 (0.03%) | 8 089 (~0%) | 1 061 001 (0.12%) | 1 113 638 (0.13%) | 2 398 (~0%) | 1 036 (~0%) | 26 933 301 (2.2%) | 263 564 (0.02%) | 464 798 (0.03%) | - | - | 4 341 (~0%) | - |
| Potlatch 0.x/1.x | 44 030 413 (7.3%) | 57 141 365 (8.9%) | 8 753 066 (1.3%) | 1 470 315 (0.2%) | 469 461 (0.07%) | 196 441 (0.02%) | 127 480 (0.01%) | 80 028 (0.01%) | 157 354 (0.02%) | 46 871 (~0%) | 54 628 (~0%) | 19 286 (~0%) | 527 (~0%) | - | - | - | - |
| Redaction bot | - | - | - | 21 303 266 (2.9%) | 284 119 (0.04%) | 102 887 (0.01%) | 81 142 (0.01%) | 195 753 (0.02%) | 278 968 (0.03%) | 323 820 (0.03%) | 308 288 (0.02%) | 3 375 623 (0.2%) | 33 835 (~0%) | 8 164 (~0%) | 521 134 (0.04%) | 1 471 (~0%) | - |
| posiki_python_script | - | - | - | - | - | - | - | - | - | - | - | 53 (~0%) | 23 049 524 (1.5%) | - | - | - | - |
| osmupload.py | - | - | - | - | 18 057 237 (2.6%) | - | 2 109 443 (0.2%) | - | - | - | 41 463 (~0%) | 11 841 (~0%) | - | - | 521 (~0%) | - | - |
| PythonOsmApi | 2 254 174 (0.4%) | 922 941 (0.14%) | 9 503 361 (1.4%) | 45 963 (0.01%) | 36 616 (0.01%) | 26 018 (~0%) | 27 225 (~0%) | 3 343 (~0%) | 7 432 (~0%) | - | - | - | - | - | - | - | - |
| bulk_upload_sax.py | 7 781 579 (1.3%) | 722 332 (0.11%) | - | 52 554 (0.01%) | - | 35 010 (~0%) | - | - | - | - | - | - | - | - | - | - | - |
| osmapis | - | - | - | 4 169 283 (0.6%) | 343 809 (0.05%) | 327 196 (0.04%) | 137 593 (0.02%) | 307 650 (0.03%) | 95 443 (0.01%) | 64 731 (0.01%) | - | - | - | - | - | - | - |
| ArcGIS | - | 15 203 (~0%) | 418 665 (0.06%) | 39 091 (0.01%) | 186 947 (0.03%) | 1 483 853 (0.17%) | 146 144 (0.02%) | 86 338 (0.01%) | 440 235 (0.04%) | 762 971 (0.07%) | 340 745 (0.03%) | 841 484 (0.05%) | 216 823 (0.01%) | 80 789 (0.01%) | 61 768 (~0%) | 33 541 (~0%) | - |
| Jeff's Uploader | - | 5 128 684 (0.8%) | - | - | - | - | - | - | - | - | - | - | - | - | - | - | - |
| SviMik | - | - | - | 5 569 (~0%) | 3 060 161 (0.4%) | - | - | - | - | - | 1 692 718 (0.14%) | 15 570 (~0%) | 3 609 (~0%) | - | - | - | - |
| FindvejBot | 262 (~0%) | 3 797 787 (0.6%) | 358 760 (0.05%) | 104 606 (0.01%) | 175 (~0%) | - | - | - | - | - | - | - | - | - | - | - | - |
| Roy | - | - | - | 1 216 065 (0.17%) | 2 940 171 (0.4%) | - | - | - | - | - | - | - | - | - | - | - | - |
| AND node cleaner/retagger | 3 314 543 (0.5%) | 108 633 (0.02%) | - | - | - | - | - | - | - | - | - | - | - | - | - | - | - |
| MyUploader | - | 2 660 404 (0.4%) | - | - | - | - | - | - | - | - | - | - | - | - | - | - | - |
| osmlinzaddr.py | - | - | - | - | - | - | - | - | 229 011 (0.02%) | 1 597 789 (0.14%) | 666 (~0%) | 4 847 (~0%) | - | - | - | - | - |
| Tayberry | - | 164 902 (0.03%) | 763 472 (0.11%) | 5 506 (~0%) | 141 914 (0.02%) | - | 221 472 (0.03%) | - | 245 462 (0.02%) | 20 769 (~0%) | - | - | - | - | - | - | - |
| rosemary | - | 22 898 (~0%) | 174 901 (0.03%) | 94 049 (0.01%) | 107 887 (0.02%) | 89 020 (0.01%) | 146 213 (0.02%) | 126 016 (0.01%) | 121 314 (0.01%) | 105 922 (0.01%) | 68 136 (0.01%) | 31 187 (~0%) | 70 926 (~0%) | 38 168 (~0%) | 31 655 (~0%) | - | - |
| FixKarlsruheSchema | 122 694 (0.02%) | 271 085 (0.04%) | 426 449 (0.06%) | 3 941 (~0%) | - | - | - | 132 (~0%) | - | - | - | - | - | - | - | - | - |
| addr2osm | - | - | - | - | - | - | - | - | - | 251 851 (0.02%) | 171 967 (0.01%) | 111 782 (0.01%) | 88 066 (0.01%) | 90 153 (0.01%) | 21 318 (~0%) | - | - |
| OsmPipeline | - | - | - | - | - | - | - | - | - | - | 1 566 (~0%) | 650 184 (0.04%) | - | - | - | - | - |
| Mapzen | 33 941 (0.01%) | 447 014 (0.07%) | 102 080 (0.02%) | 6 686 (~0%) | 1 086 (~0%) | 749 (~0%) | 33 (~0%) | 7 (~0%) | 6 (~0%) | 8 (~0%) | - | - | - | - | - | - | - |
| Services_OSM | - | - | - | 28 736 (~0%) | 18 942 (~0%) | 99 656 (0.01%) | 124 012 (0.01%) | 60 583 (0.01%) | 53 450 (0.01%) | 1 704 (~0%) | 22 260 (~0%) | 126 712 (0.01%) | 509 (~0%) | 2 074 (~0%) | 76 (~0%) | 41 (~0%) | - |
| Map builder | - | - | - | - | - | - | - | - | - | - | - | - | 3 768 (~0%) | 69 618 (0.01%) | 100 285 (0.01%) | 235 241 (0.02%) | - |
| Other | 2 400 228 (0.4%) | 1 386 174 (0.2%) | 963 331 (0.14%) | 971 718 (0.13%) | 703 363 (0.10%) | 717 527 (0.08%) | 300 534 (0.03%) | 391 457 (0.04%) | 557 524 (0.06%) | 277 646 (0.02%) | 604 730 (0.05%) | 963 551 (0.06%) | 2 438 482 (0.16%) | 1 284 915 (0.10%) | 2 867 157 (0.2%) | 2 257 669 (0.17%) | 471 258 (0.07%) |
| Not Specified | 167 313 853 (27.7%) | 9 066 286 (1.4%) | 1 670 818 (0.2%) | 2 752 021 (0.4%) | 1 173 684 (0.17%) | 3 873 676 (0.4%) | 1 404 891 (0.16%) | 1 434 152 (0.16%) | 460 971 (0.05%) | 765 721 (0.07%) | 466 112 (0.04%) | 878 287 (0.06%) | 8 819 070 (0.6%) | 619 327 (0.05%) | 164 386 (0.01%) | 141 881 (0.01%) | 44 020 (0.01%) |
An edit in this statistic is defined as any change made on a map data element (node, way or relation) that results in a new version of that element.
So,
- changing one tag of one element counts as one edit
- changing any number of tags on one element counts still as one edit
- changing the geometry of a way counts as as many edits as nodes have been moved because seen from the technical side, not the way is changed, but the position of each node the way consists of
Note the definition of what consists of an edit in these statistics written above this table when interpreting these numbers and charts. For example:
- Tracing a road from aerial imagery consisting of 100 vertices or moving the whole way results in 100 edits, moving some of the nodes will result in as many changes as nodes moved
- Adding a POI for a new shop and supplying all the info available like name, address, phone number, website, opening hours, wheelchair accessibility etc. counts still as one 1 edit, if done in the same changeset
- Changing a nodes position and tags in the same changeset counts as 1 edit
So to summarize, edits that change geometry are likely overrepresented over edits that add or change information on existing geometry when using this metric.


More complex analysis
The tables and plots above present very simple and straightforward analyses whose interpretation is unambiguous. They do, however, subtly obscure more nuanced realities about our userbase, and the "number of users" analysis in particular has a few weak points.
For each editor, the table gives the number of users who have made at least one edit with it, with no distinction made between regular and one-time users nor between using an editor as one's primary tool vs. just trying it out once. For example, most users make their first edits using one of the online web-based editors (Potlatch 1 in the old days, then Potlatch 2, and nowadays mostly iD). They are all counted as that editor's users, even if they quickly turn away from OSM or choose another editor for the majority of their later edits.
The plot below, the work of User:Nop, constitutes an attempt to avoid these weaknesses and associate each user with their primary or preferred editor. The main differences of this analysis are:
- Only the regularly-used editors of each user are counted, with regular use meaning that it was used for at least 30% of their edits in that month.
- Data is examined by month, not cumulatively over an entire year, so trends are more visible and the resulting analysis has a much finer resolution.
- The plot is linear by market share of the major editors as a percentage and should be more easily comprehended than logarithmic scales.
- Only the users (by unique user ids) are counted, not how many edits they performed.
- Scripts and major known bots are filtered out.

Observation on "More complex analysis"
The author tries to address weaknesses in prior work, and these clearly do exist, however due to the 30% cut off, the net result is that the numbers are even more biased towards geometry editing than other results. The other issue is that "single user" apps, for example the original maps.me are overrepresented due to the same issue (counting one time use which the author considers an issue).
Editor profiles (2012)
In this section, a selection of editors are displayed at their position in a two-dimensional space spanned by various quantities which allow some characterisation of the editor. (The selection is more or less arbitrary. If your favourite editor is missing, please complain.) All figures are for edits in the year 2012 only.

The first plot displays each editor by the number of its users and the total edits made using it, which may be interpreted as the editor's total impact on the OSM database. The distribution of editors across the plot is roughly diagonal: There is a mainstream region in the upper right, where editors have a large user basis and are used to create or modify large amounts of data: JOSM, Potlatch 2 and - to a lesser extent - Merkaartor and Potlatch 1. All other editors are used by relatively few mappers (down to just one), and consequently, relatively few edits are made with them. Only a few specialized tools for large-scale edits appear somewhat off-diagonal.

The second plot again has the number of each editor's users on the horizontal axis, but now the average size of each changeset is plotted on the vertical axis. This tells us something about how each editor is used - for editing only few objects, or for larger changesets. The number of edits in a changeset using one of the mainstream editors is of the order of 100. Surprisingly, the average JOSM changeset is only roughly a factor of 2 larger than the average Potlatch 2 changeset. Various other editors (often mobile applications) usually make only a few edits in each changeset. As expected, specialized tools for large-scale edits (used by only few mappers) generate large changesets. Of course, these are all just average values, which tell nothing about the distribution of changeset sizes. We will address that issue below and try to explore the distribution of changeset sizes.

As mentioned, the average size of a changeset (i.e. the number of edits in it) provides only very little information about how an editor is used - some number appearing as an average value may result from very different distributions. To visualize the distribution of changeset sizes, quantiles are plotted for the mainstream editors in the plot to the right. Each box describes the changeset sizes which make up 50 %, 90 % etc. of all changesets created using a given editor (e.g. 50 % of all Potlatch 1 changesets contain 4 objects or less, 90 % contain no more than 58 objects). The 50 % quantile is the median; for both Potlatch versions, this is roughly identical to the average. For JOSM and Merkaartor, both measures differ significantly, hinting a larger tail of the changeset size distributions.
Note: I am aware that this plot badly needs some cosmetic improvements. Please be patient.

The distribution of changeset sizes is also represented in this histogram, that is, a diagram showing how many changesets exist with 1-100 edits, 101-200 edits, and so on. (Empty changesets - 0 edits - are dropped here.) Clearly Potlatch 1 is hardly ever used for making more than a few edits, while the number of changesets made with Potlatch 2 forms a nearly constant fraction of the corresponding number of changesets made with JOSM for quite a large range of changeset sizes. Only for really large changesets with more than, say, 5000 edits, this fraction drops off significantly and goes to zero around 20 000 edits (see the corresponding histogram for the full range up to 50 000 edits). Another diagram for the low end (up to 200 edits) is also available.
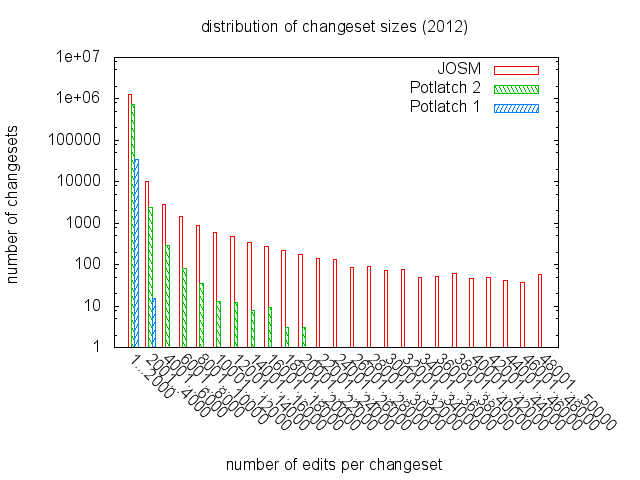
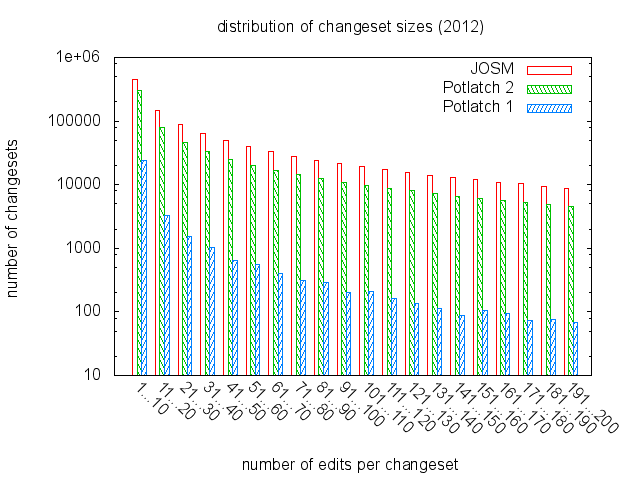
Update discipline of JOSM users

How regularly do JOSM users update their editor? This plot shows the JOSM versions in use in a given month, weighted by the number of changesets and clustered by the version number's leading digits. The majority of users clearly keeps their JOSM largely up-to-date, working with at least a recent "tested" release - commercial software manufacturers must envy the JOSM developers. The average version in use is roughly three months behind the current release; however, also very old versions are still being used by a small but nonvanishing and apparently die-hard number of mappers. Even the ancient release 1566 from May, 2009 is still seen occasionally.
There is also another plot which covers a longer term.
See also
- Script used to generate regularly updated statics on this page
- History of OpenStreetMap
- https://piebro.github.io/openstreetmap-statistics/
- OSMstats: Changesets — part of ResultMaps (specifically, the "Daily used editors by number of users (distinct uids)" chart, and the monthly variant)