Party render
Party render is a tool (a couple of python scripts) for rendering the GPS tracks from a mapping parties, as a static image or a video, with each individual mapper's track shown in a different colour.
Party renderings became something of a ritual in the early days of OpenStreetMap. Mapping parties would always involve lots of intensive recording of GPS tracks, and getting together all of this data at the end of the day, was all part of the fun.
The basic approach

The basic ritual is to produce an image of all the tracks as follows:
- Get everyone to offload their tracks onto one laptop.
- Open all 30 GPX files in JOSM
- Select the first GPX file, and choose a colour for it
- Choose colours for the other GPX files, trying to find unique colours that haven't already been used
- Take a screenshot
- Send to the press! or stick it on the wiki at least
The resulting image is like that shown on the right (Mapping party results).
Question is: could this be automated?
The 'party render' tools
The answer: of course
Enter some scripts to do the dirty work:
- render.py -- generate a static render from GPX tracks with legend
- video.py -- video animation showing traces over time
Both scripts are available from the Subversion repository.
If the code in the SVN is not working try this one and is maintained by user:OJW.
Requirements
Both scripts require the following:
In addition the animated version (video.py) needs:
- pymedia.video.vcodec python library (See pymedia on Ubuntu Hardy Heron for a guide to installing PyMedia on Ubuntu); a .deb package of PyMedia compiled with GCC-4 for Ubuntu Intrepid Ibex is here.
- Pygame library (required by Pymedia for video playback)
Building pymedia
Pymedia doesn't build on gcc-4 out of the box, here's how to fix it:
- Get pymedia-1.3.7.3
- Apply this patch (referenced here) (if these links go bad, look for Your whishlist for Debian Packages? thread)
- If you're on a platform different than 32-bit i386, you can try this patch because compilation is broken without it.
- sudo python setup.py install
Ubuntu
On Ubuntu the following will help get you started:
sudo apt-get install libcairo2 python-cairo python-media python-game python-pygame
Also, see the note about including additional headers below. This is necessary at least for Ubuntu 12.04.
Dependencies on OpenSUSE
To get this working on OpenSUSE, follow these steps:
- Install dependencies:
zypper in python-cairo python-pygame libvorbis-devel python-devel
(latter is needed to compile pymedia)
- There doesn't seem to be a package for pymedia, so download source archive and compile & install it according to README. Contrary to the note above, pymedia-1.3.7.3 compiles just fine (lots of warnings, but no errors) with gcc 4.4.1 from OpenSUSE 11.2.
- Compilation may fail on OpenSUSE 11.4 with
/usr/include/python2.7/pyport.h:146:25: error: expected '=', ',', ';', 'asm' or '__attribute__' before 'Py_uintptr_t'
- adding #include "stdint.h" before #include <Python.h> in demuxer.c, muxer.c and vcodec.c seems to help.
Basic Usage
Place your GPX files under a directory, and run:
python render.py -d DIR
or
python video.py -d DIR
Detailed Usage
You will probably want to tweak some parameters, such as the map area shown in the render.
Options
- -d Directory to scan for GPX files
- Will be scanned recursively
- Files ending in ".gpx" only
- -s Image size (pixels)
- Actual image width will be larger, to accommodate the key
- -p Size of each dot (static version only)
- Seems to be in mm for some reason. 1 is normal
- -r Radius of map in kilometres
- -g Gazeteer filename
- Location of an OSM file containing city/town/village nodes
- Use "osmxapi" to download it from the internet (default)
- Use "none" to prevent displaying cities
- -f Number of seconds of real time to show in each frame (animated version only)
- -t Title of animation (default: Mapping Party) (animated version only)
- --pos=lat,lon Centre of the map
- If not supplied, will centre on the mean average of your trackpoints
- --no-fade Disable the end of the video fading to the current map
Run python render.py --help or python video.py --help to get the full, up-to-date, list of command-line options.
Tips
- When creating an animated party render, try generating a static render first. This is quicker, and is useful for tweaking the bounding box and resolving errors.
- You have multiple GPX files for one person, and you want show their traces in the same colour. Use gpsbabel to merge the files.
- Legend
- Legend titles are taken from GPX filenames, removing ".gpx" from the end;
- If your legend is too wide and bleeds over image edge, you can edit corresponding file. Look for the line starting with "fullwidth = width +" - the value that is added is width for legend. Just increase it and try rendering an image until you are satisfied.
- If you would like to customise title or credit pages for the video, check out lines using "page.text", or line defining "title" variable.
- If you would like to use unicode in title or credit pages (gpx filenames, and thus legend, are handled correctly already), you also have to add as the second line of video.py "# coding=utf-8"
- Passing a gpx file twice (having another copy of it in a subdirectory, for example) seems to break rendering of video.py.
Common Problems
Script fails when downloading gazetteer
| This Script makes usage of Gazetter nameservice, which is deprecated. It has to be changed to use Nominatim instead. |
Try the option -g none. Downloading the gazetteer can fail when XAPI is down or giving bogus responses, or maybe the request simply timed out. This option tells party render not to use a gazetteer and avoids downloading it.
Alternatively, you can try downloading a gazetteer yourself then passing the file to party render:
- Look for the bounding box used in the output. You should see something like:
- Lat 52.140146 to 52.230146, Long -2.011818 to -1.865026
- Download the gazetteer from XAPI with predicates '[place=city|town|village]' and the bounding box from step 1. For example:
wget -Ogazetteer.xml 'http://www.informationfreeway.org/api/0.6/node[place=city|town|village][bbox=-2.011818,52.140146,-1.865026,52.230146]'
- Run the renderer with the '-g' parameter:
python video.py -g gazetteer.xml
Code
Source code is in Python, and located in SVN with history
Structure
- SAX used for parsing GPX files
- Cairo is used for drawing
- Data is stored as a hash of files
- each containing a list of trackpoints
- each of which is a tuple of (lat,lon) in degrees
- each containing a list of trackpoints
- width is the width of the map itself - the actual image is fullwidth and includes the key
- Y values start from 0 at the top and increase downwards
Maths
Naively, you might think you could take the extents of the trackpoints and use those to scale the map. Doesn't work - nearly everyone has erroneous points from middle of the atlantic, or from their home town 100 miles away.
Theoretically, the best algorithm to scale the map would be Median absolute deviation, since you can ask it for the middle 90% (say) of points and ignore outliers completely. However, I've had some trouble getting MAD to work on 200,000+ points (The O(n) algorithm uses quicksort and uses too much memory/recursion depth. Other algorithms are just very slow)
- There is a suggestion to use MAD on a subset of the points, e.g. every 1/1000 points. Ojw 17:35, 14 October 2007 (BST)
(note: on my tests, the "real map" only covers about 0.1 standard deviations, so SD doesn't look like a very good measure either)
So the current version just asks for how many kilometres you want, and centres the map on the average (mean) position of trackpoints. But we should try and find a better way of doing it from the tracklogs themselves.
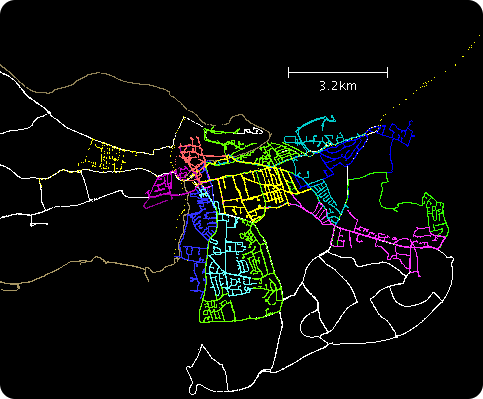
Sample output
-
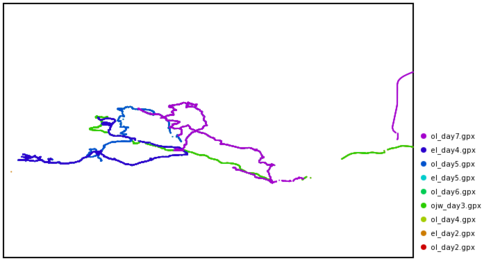 Devon - White background
 -
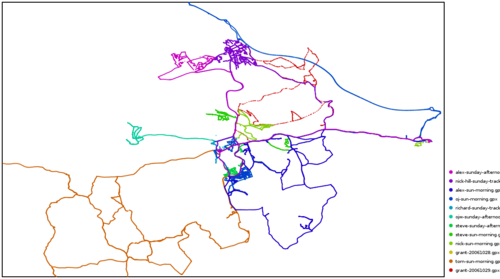 Surrey Hills (Sunday) - White background
 -
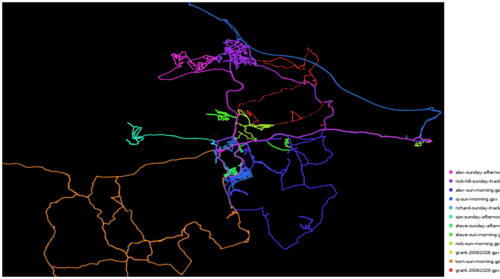 Surrey Hills (Sunday) - Black background
 -
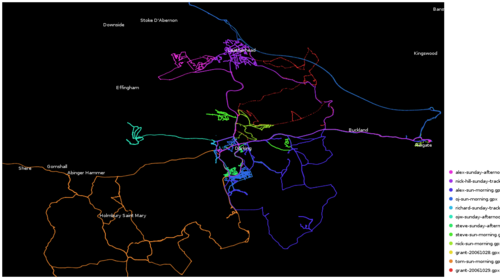 Surrey Hills (Sunday) - Black background - with city names


For an example animation, see the Surrey Mapping Party on YouTube.
Rendered Mapping Parties
- Pavia Mapping Party - January 6th 2008
- Wales Mapping Weekend - 13th/14th September 2008 (details)
- Bradford Mapping Party - 27th/28th September 2008 (details)
- Reykjavík Mapping Party - 21 September 2008 (details)
- Manchester Mapping Party - 25th/26th October 2008 (details)
- Birmingham Micro party 1st Nov 2008 - 15MB mpg -(details)
- Stratford‐upon‐Avon Mapping Party - 15th November 2008 (details)
- Evesham Mapping Party - 16th November 2008 (details)
- Pompeii Mapping Party - 5-6 December 2008 (details)
- Akranes (lonely) mapping party - 13 December 2008 (details)
- Reykjavík Mapping Party - 30 December 2008 (details)
- Milton Keynes Mapping Party - 16th/17th May 2009 (details)
- Cēsis, Latvija mapping party - 10th July 2010 (details, including party render image & before/after image)
TODO: Many of the abpve example links were on blip.tv which seems to be shut down. But do these videos still exist anywhere?
Alternatives
- GPX Animator - a newer tool generates video from GPX tracks in a different style. It is much easier to get running and works on many platforms. Feel free to report your wishes or issues.
- gpsvisualizer.com - for SVG export
- avtanski.net/projects/gps - For great animations
- osm-progress - A video generating tool, showing edits. by Derick
See also GPS tracks#Rendering.