ES:Featured images/Apr-Jun 2016
Jump to navigation
Jump to search


Estas son imágenes destacadas, que se han identificado como los mejores ejemplos de mapeo de OpenStreetMap, o como ilustraciones útiles del proyecto OpenStreetMap.
Si conoce otra imagen de calidad similar, puede nominarla en propuestas de imagen destacada (en).
| ← de abril a junio 2015 | ← de enero a marzo 2016 | de julio a septiembre 2016 → | de abril a junio 2017 → |
Galería de imágenes destacadas, de abril a junio de 2016
-
 2016, semana 14
 -
 2016, semana 15
 -
 2016, semana 16
 -
 2016, semana 17
 -
 2016, semana 18
 -
 2016, semana 19
 -
 2016, semana 20
 -
 2016, semana 21
 -
 2016, semana 22
 -
 2016, semana 23
 -
 2016, semana 24
 -
 2016, semana 25
 -
 2016, semana 26
Detalles y subtítulos
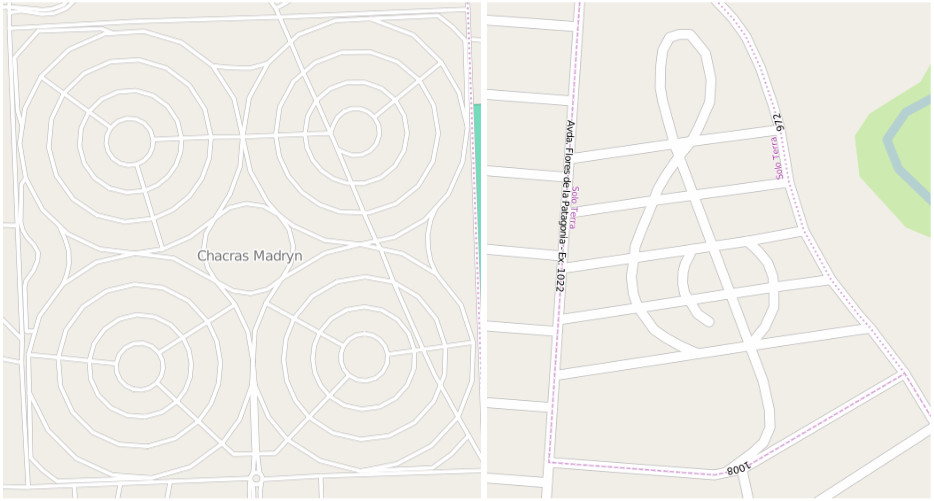
Semana 14 (desde el lunes 4 abril 2016 hasta el domingo 10 abril 2016) [Edit]

- English : Argentina has some curious street layouts. In the city of Puerto Madryn there is a suburb with concentric circular streets and in El Calafate a suburb (Solo Terra) whose streets form a treble clef!
Semana 15 (desde el lunes 11 abril 2016 hasta el domingo 17 abril 2016) [Edit]

- English : India has 22 languages and one of the powerful features of OpenStreetMap is that we can map places and feature names in more than one language. User PlaneMad has created a view of this data. A multilingual map of India. Read more on his diary entry.
Semana 16 (desde el lunes 18 abril 2016 hasta el domingo 24 abril 2016) [Edit]

- English : Heatmap of addresses across Epworth, in Harare Province, Zimbabwe. An example of planning and reporting efforts needed to create or improve Missing Maps in Africa.
Semana 17 (desde el lunes 25 abril 2016 hasta el domingo 1 mayo 2016) [Edit]

- English : Colombian mapper Fredy Rivera likes to take his 4x4 and map mountain trails for OpenStreetMap. With such stunning scenery in the Andes, who can blame him?! Fredy was featured in this mapper in the spotlight blog post.
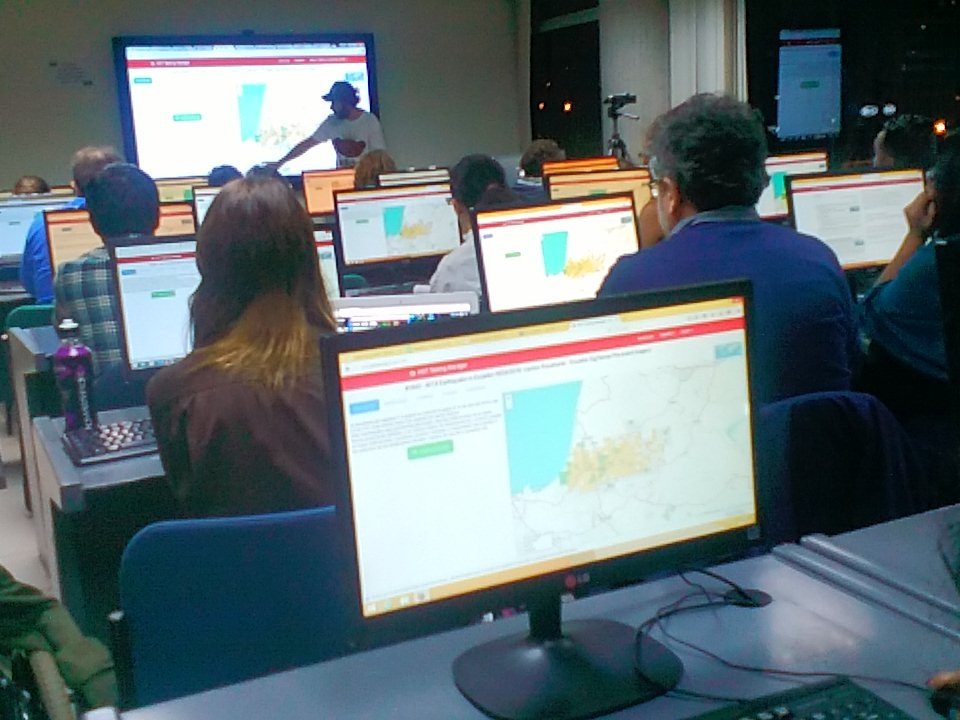
Semana 18 (desde el lunes 2 mayo 2016 hasta el domingo 8 mayo 2016) [Edit]

- English : Students at MediaLab UIO in Ecuador mapping in response to the recent earthquake, using the OSM Tasking Manager to coordinate with mappers around the world. Read more on their blog (in Spanish) and on the 2016 Ecuador earthquake page.
Semana 19 (desde el lunes 9 mayo 2016 hasta el domingo 15 mayo 2016) [Edit]

- English : The new OSM Analytics tool showing progress with mapping buildings in Haiti, by comparing on a timeline, and with a visual side-by-side map slider.
Semana 20 (desde el lunes 16 mayo 2016 hasta el domingo 22 mayo 2016) [Edit]

- English : Web developers learning about mapping at this developer focused mapping workshop organized by Kathmandu Living Labs in Nepal.
Semana 21 (desde el lunes 23 mayo 2016 hasta el domingo 29 mayo 2016) [Edit]

- English : Nama Budhathoki of Kathmandu Living Labs describing the 2015 Nepal earthquake mapping response at Understanding Risk conference in Venice (session info).
Semana 22 (desde el lunes 30 mayo 2016 hasta el domingo 5 junio 2016) [Edit]

- English : The State of the Map France 2016 conference took place in Clermont-Ferrand last weekend.
Semana 23 (desde el lunes 6 junio 2016 hasta el domingo 12 junio 2016) [Edit]

- English : Students and Teachers in Kyrgyzstan creating detailed maps of their villages. Read more on the HOT blog.
Semana 24 (desde el lunes 13 junio 2016 hasta el domingo 19 junio 2016) [Edit]

- English : Members of Swiss OSM (SOSM) shared a stand at Geosummit in Bern. Demonstrations included "Map on a Stick" and a variety of printed maps based on OSM. Swiss Federal Councillor & Minister for Defence and Sports, Guy Parmelin, is discussing the mapping of his home town of Bursins with prof. Stefan Keller (HSR, Rapperswil).
Semana 25 (desde el lunes 20 junio 2016 hasta el domingo 26 junio 2016) [Edit]

- English : A bus map produced with OpenStreetMap, is now being used and enjoyed by the people of Managua, Nicaragua. This article tells the story.
Semana 26 (desde el lunes 27 junio 2016 hasta el domingo 3 julio 2016) [Edit]

- English : Presented at OSMit2016, this moving 3D model by OpenDot Lab is the latest way to visualise OpenStreetMap stats! Watch a video here.