Maxheight Map
| OSM Truck QA Map | ||||||||||||||||||||||||||||||||||||||||||||||||||||||||||||||||||||||||||||||||
|---|---|---|---|---|---|---|---|---|---|---|---|---|---|---|---|---|---|---|---|---|---|---|---|---|---|---|---|---|---|---|---|---|---|---|---|---|---|---|---|---|---|---|---|---|---|---|---|---|---|---|---|---|---|---|---|---|---|---|---|---|---|---|---|---|---|---|---|---|---|---|---|---|---|---|---|---|---|---|---|---|
 | ||||||||||||||||||||||||||||||||||||||||||||||||||||||||||||||||||||||||||||||||
| Author: | mmd | |||||||||||||||||||||||||||||||||||||||||||||||||||||||||||||||||||||||||||||||
| Platform: | Web | |||||||||||||||||||||||||||||||||||||||||||||||||||||||||||||||||||||||||||||||
| Languages: | German, English, French, and Spanish
| |||||||||||||||||||||||||||||||||||||||||||||||||||||||||||||||||||||||||||||||
| Website: | http://maxheight.bplaced.net | |||||||||||||||||||||||||||||||||||||||||||||||||||||||||||||||||||||||||||||||
|
Identify missing maxheight=* tags under (railway) bridges - Maxheight Map | ||||||||||||||||||||||||||||||||||||||||||||||||||||||||||||||||||||||||||||||||
| ||||||||||||||||||||||||||||||||||||||||||||||||||||||||||||||||||||||||||||||||
Maxheight Map gives you important information about existing maximum height, width, length, weight, axle load, maximum speed, truck access restrictions (no through-traffic, no hazardous materials) as well as truck toll roads.
Introduction to Maxheight Map
Target audience
This Wiki page is intended for anyone who is interested in truck routing or wants to help improve truck routing using OpenStreetMap data.
What is this Maxheight Map good for and why should I care?
You've probably already come across the OpenStreetMap mapnik map or other OSM based maps on your iPhone, Android, Garmin... device. Many of those maps don't specifically target truck routing requirements: they won't e.g. show any restrictions for hazardous materials, maximum height or weight. However, as OpenStreetMap is primarily a database with geographic content, there's a wealth of details available 'under the surface'.
Maxheight Map aims at closing this gap and gives you important information about existing maximum height, width, length, weight, axle load, maximum speed, truck access restrictions (no through-traffic, no hazardous materials) as well as truck toll roads.
Moreover, its Missing Maxheight Tag map layers provides some hints where maximum height details might still be lacking in the OpenStreetMap data.
How can I get involved and help improve the map?
This is really simple!
Check you neighborhood on the map and find tunnels or overpasses without height restriction and add the data to OpenStreetMap! Some of the data is not up-to-date or lacking? You can help as well, OpenStreetMap is free to everyone who want to add new, enhance existing or remove outdated information.
If you don't have a user account on osm.org, you can also add notes with your knowledge about the reality out there on the main osm.org page. Fellow mappers will go through your notes and add the data to the OpenStreetMap database after validation.
A few words on the project history
User:Win32netsky started a discussion on adding maximum height infos on the German Forum in October 2011. Maxheight Map was launched with a small prototype in Summer 2012 as a PostGIS based, weekly updated map with Germany only coverage. Since January 2013 the map is based on Overpass API and now comes with a world-wide coverage and data analysis in real-time. Any data you add will be reflected on the map within a few minutes!
While relevant ways are rather easy to find for the first two layers, analysis for roads under bridges needs some way to find out intersection points. This is where Overpass API's powerful around function comes into play and provides you with a number of spots in your area you can use in your fieldwork activities.
Besides maxheight tags this map also shows a number of other Truck related tags such as maxweight, maxwidth, toll to help you validate and enhance existing OSM data.
Happy mapping!
Link to the map: http://maxheight.bplaced.net
Missing maxheight tags - some background
If you want to learn a bit more on how Maxheight Map identifies missing maxheight information and how it is shown on the map, this section is the place to go.
Optional reading - you can start browsing the map right away and come back here later if needed
Analysis Methods
How do we find out if a maxheight tag is missing?
A missing maxheight tags under a bridge depends on the following factors:
- No maxheight tags was set on the way under the bridge
- No single node on the way under a bridge was tagged with maxheight. A maxheight tag on a node is only considered if close enough to the intersection point (about 20-30m).
For the two layers covered and tunnel a maxheight tag on a node is also sufficient, it will be propagated to the whole way.
Per convention maxheight tags are usually added to the relevant section of a ![]() way rather than a single
way rather than a single ![]() node on the way.
node on the way.
Please note that unconnected maxheight nodes (i.e. "a maxheight sign put next to a road") will be ignored! This is due to the fact, that any routing software based on OSM data has no clue to which way this unconnected maxheight node belongs to. If you choose to add maxheight information as ![]() node be sure to always add it one of a way's nodes. See the following example where a maxheight
node be sure to always add it one of a way's nodes. See the following example where a maxheight ![]() node 1686140598 belongs to a way.
node 1686140598 belongs to a way.
| Layer name | Existing Tags on Ways | Missing Tags | Ignore ways tagged as | Detailed description |
|---|---|---|---|---|
| covered | covered=*
|
maxheight=* or maxheight:physical=*
|
Shows all relevant highways tagged as covered=yes without maxheight tag. | |
| tunnel | tunnel=yes, tunnel=building_passage
|
man_made=adit
|
Shows all relevant highways tagged as either tunnel=yes or building_passage without maxheight tag. Ways tagged as man_made=adit are ignored. | |
| way below railway bridge | railway=*, bridge=yes, bridge=viaduct
|
tunnel=*
|
Starting with ways tagged as railway=* and bridge=yes or bridge=viaduct any relevant intersecting highways without maxheight or maxheight:physical tags are shown. Tunnels are excluded. | |
| way below bridge | bridge=yes, bridge=viaduct
|
tunnel=*, railway=*
|
Starting with ways tagged as bridge=yes or bridge=viaduct (this time without any railway=*), any relevant intersecting highways without maxheight or maxheight:physical tags are shown. Tunnels are also excluded. |
Note: Missing maxheight tag analysis is limited to the following highway values: primary, secondary, tertiary, trunk, service, residential, primary_link, secondary_link, tertiary_link and unclassified.
Visualization
Maxheight Map supports two different ways of highlighting missing maxheight tags: while the Line style depicts OSM ways in full length, the Point style focuses on the intersection point itself.
For more complex intersections the Line Style may be easier to work with, as it gives you more details about the individual OSM ways. On the other hand in more rural areas the Point Style might be just sufficient to see what's going on. The Point style also uses clustering to reduce the number of points when zooming out. Depending on your preferences you can always switch back and forth between the two modes in the Sidebar.
Note: Tunnel and Covered ways are always shown as way regardless of the Intersection style chosen.
-
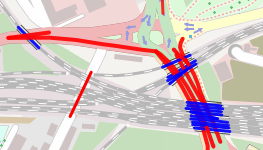 Line Style
 -
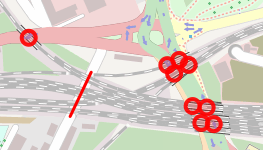 Point style


The following table summarizes the color keys for the line style.
| Layer | Comment | Color |
|---|---|---|
| layer=0 | Default value, if not tagged |
|
| layer=1 | Default value for bridge=yes, bridge=viaduct |
|
| layer=2 |
| |
| layer=3 |
| |
| layer=<other> |
|
Miscellaneous layers for trucks
Besides checking for missing maxheight tags you can also use this map to see what's already there in terms of truck related tags. The following table briefly summarizes all relevant tags along with a color key. Actual max*... values can be shown/hidden by pressing the ![]() button on the lower right corner of the map.
button on the lower right corner of the map.

| Layer name | OSM Tags | Color Keys | ||||||||||||||||||||||||||||||||||||||||||
|---|---|---|---|---|---|---|---|---|---|---|---|---|---|---|---|---|---|---|---|---|---|---|---|---|---|---|---|---|---|---|---|---|---|---|---|---|---|---|---|---|---|---|---|---|
| maximum height | maxheight=*
|
The default value of 4m can be adjusted in Simulation mode. Multiple values separated by a semicolon are evaluated on a one-by-one basis, the highest value wins. maxheight values may be specified in inch/feet or metric values. In case the node/way was only tagged with maxheight:physical, this tag will be evaluated instead with the same color key as shown above. | ||||||||||||||||||||||||||||||||||||||||||
| maximum width | maxwidth=*
|
If used, ways will be marked red. Please suggest a suitable schema on the discussion page. | ||||||||||||||||||||||||||||||||||||||||||
| maximum length | maxlength=*
|
If used, ways will be marked red. Please suggest a suitable schema on the discussion page. | ||||||||||||||||||||||||||||||||||||||||||
| maximum weight | maxweight=*
|
The default value of 7.5t can be adjusted in Simulation mode. | ||||||||||||||||||||||||||||||||||||||||||
| maximum axleload | maxaxleload=*
|
If used, ways will be marked red. Please suggest a suitable schema on the discussion page. | ||||||||||||||||||||||||||||||||||||||||||
| maxspeed for hgv | maxspeed:hgv=*
|
Colors inspired by Maxspeed Karte. | ||||||||||||||||||||||||||||||||||||||||||
| hgv=* & hazmat=* | hgv=*, hazmat=*
|
| ||||||||||||||||||||||||||||||||||||||||||
| toll | toll=*, toll:N3=*, barrier=toll_booth
|
|
Sidebar
Unlike the Layer selection pane, the Sidebar on the left hand side of the map is closed by default, if your screen width is too small. Use the icons ![]() and
and ![]() to open/close the panel or click on the gray area for slide open.
to open/close the panel or click on the gray area for slide open.
Here's a brief overview of the features you can find in the Sidebar:
Search
Fulltext search provided by Nominatim takes to you any place you enter in the search field.
History
The new History tab allows you to go back in time and inspect OSM data at any given day since September 2012. It leverages the new date feature available since Overpass API v0.7.50. A typical usage scenario could be to evaluate how the mapping coverage in certain area developed over time or trace back some maxheight tags which have been accidentally deleted in the past.

Infos
Created by
Attribution
- jquery ui + layout based design used with permission of misterboo (on OSM)

- Search provided by Nominatim
- Data provided by Overpass API

Options
Opacity
Control the background map's brightness for a better contrast.
Simulation
In Simulation mode you can adjust both parameters Vehicle Height and Weight. At this time, this will only affect the color keys.
Let's assume you've put the Vehicle Height slider at a maximum height of 4.00m. All ways/nodes with maxheight >= 4.00 on the map will be shown in blue, while smaller maxheight values are shown in red (-> your simulation vehicle is too high for this way).

Vehicle Height: Simulate range from 1.00 - 4.00 m
Weight: Simulate range from 1.0 - 30.0 t
GPS Position
Locate me: Uses your browser's Geolocation API to zoom to your area. Depending on GPS/Wifi availability the results may be more or less accurate.
Track my position: Automatically update your current location every 10 seconds.
GPX Export
The GPX Export feature might come in handy if you want to want to download Missing maxheight locations to your GPSr or make it available for offline use on your mobile device. The picture on the right is an actual screenshot of a Garmin Oregon with a few Missing Maxheight locations as waypoints.
Please follow these steps:

- Zoom to your area of interest on the map
- Select any number of the four missing maxheight tag overlay layers you're interested in
- Make sure to select Intersection style Point in the Sidebar
- Export all points shown in current map view as GPX for easy routing planning in Basecamp/QLandkarteGT or to check missing maxheight tags on the road (offline usage)
- Transfer the GPX file to your GPSr
Points are exported as Waypoints with "MH ..." prefix
Note: This feature is only supported on Chrome and Firefox. For some reason Firefox creates .part files in your download directory, which have to be manually renamed to .gpx.
Keyboard Shortcuts
| Keys | Action |
|---|---|
| Ctrl+↑ | Open/Close North panel |
| Ctrl+← | Open/Close West panel |
| Ctrl+→ | Open/Close East panel |
Technical details
All data on the Maxheight Map is provided directly via the Overpass API. If you run your own Overpass API instance, make sure to use at least version 0.7.2.
Supported browsers
- Desktop
- Firefox
- Internet Explorer 8 and later versions
- Google Chrome
- Opera
- Mobile
- Android Browser
- Chrome
- Firefox
- Opera mobile (latest version with Chromium-based rendering engine)
- Dolphin Browser
URL parameters
| Parameter | Description | ||||||||||||
|---|---|---|---|---|---|---|---|---|---|---|---|---|---|
| lat, lon, zoom, layers | Latitude, Longitude, Zoom, Activated Layers (usual OpenLayers syntax applies) | ||||||||||||
| label | Show labels. Parameter values include F (false) or T (true) | ||||||||||||
| style | Show intersections as line or point | ||||||||||||
| opacity | Set background opacity. Permitted values include 0 .. 100 (0 = map white) | ||||||||||||
| timeout | Override default timeout of 10 seconds for some layers. Maximum value is 300 (seconds) | ||||||||||||
| lang | Override automatically detected language. Example: &lang=en for English texts | ||||||||||||
| server | Overpass API Server:
|
See also
- OSM Transport Karte - a Garmin Map for Truck routing.