HOT - PDC InAWARE Indonesia Mapping Project
About the Project
This program is a joint venture with the Pacific Disaster Center (PDC), Badan Nasional Penanggulangan Becana (BNPB), PetaBencana.id , and Humanitarian OpenStreetMap Team (HOT) Indonesia (Currently Perkumpulan OpenStreetMap Indonesia) to support disaster management tools and data for Indonesia.
This project has been mapped in 3 cities in Indonesia. The first city was Surabaya (October 2016 - February 2017), the second city was DKI Jakarta (March - November 2017), and the third city was Semarang (February - July 2018). These mapping activities were done by the Humanitarian OpenStreetMap Team (HOT) Indonesia with cooperation and support from the local government such as city government and local disaster management agency (BPBD). The BPBD supported the regulation and permission letter to collect the data in the field. Then the local university has supported to digitize the buildings and roads through Mapathon activity. After the projects the local partners continued the project sustainability, we trained them about how to update and use the OSM data by ToT training.
In each city we have collaboration with the local university and BPBD:
- Surabaya: BPBD Jawa Timur and Sepuluh November Institute of Technology (ITS)
- DKI Jakarta: BPBD DKI Jakarta and University of Indonesia
- Semarang: BPBD Semarang and Jendral Soedirman University
The aim of this project is to complete and provide spatial open data for public so it can be used for any disaster management sector by National Government (BNPB) and Local Disaster Management Agency (BPBD).
Activities
1. Planning and Preparation
- Assessment with existing data in OpenStreetMap and the local government such as boundary administrative as a initial map and information for the mapping and survey activity.
- Created the data model for the infrastructures mapped that related with disaster preparedness
- Developed OpenMapKit and ODK Collect for mobile data collection
- Created the survey village maps with admin boundary and basemap OSM, satellite imagery
- Kick off and meeting with BPBD and university
- Recruitment the data entry and quality assurance staff
2. Capacity Building with the BPBD and university
We conducted the training and mapathon with tasking manager to complete initial data in the field such as building footprints and roads. This activity has been done through Mapathon with students from the local university.
3. Field Data Collection
Field Survey to collect all information of buildings, roads and critical infrastructures. This activity was also involved discussion with village representatives to determine and update administration boundary such as sub-villlage and village boundary.
4. Quality Data & Analysis Data
Ensure the quality of the data was essential activities in the project, we have dedicated team to improve and validate the data from the surveyor, volunteer, and data entry. After the activity, we downloaded the data to analysis dan create thematic maps. We have printed all maps related to survey and mapping activities. These maps are villages maps of city project, infrastructures map and thematic maps for local disaster management agency (BPBD).
5. Distribute the maps and Create the Atlas
We distributed the all infrastructures maps for the village offices and hazard maps for BPBD. The atlas was represented the thematic maps and all the villages maps.
6. Training of Trainer for Project Sustainability
Conducted the trainings and workshops to share knowledge about this project and all related material on it to local disaster management agency (BPBD) and the local university in each city. The training material was provided on the PDC documentation toolbox web that people can be accessible. After the project we created the video documentation for learning and sharing with the wide community.
Mapping Team Structure
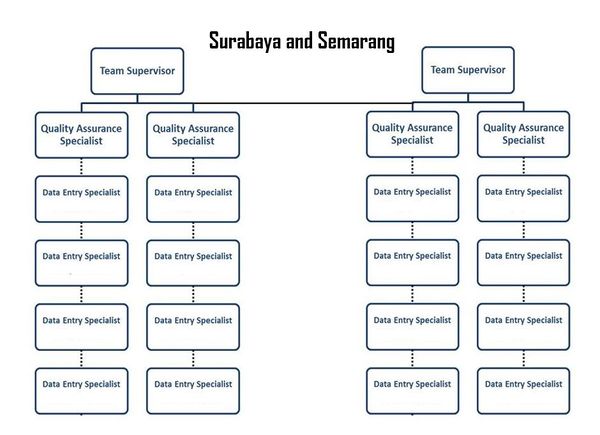
The project has 2 different mapping team structures. Surabaya and Semarang have a smaller size than DKI Jakarta, therefore, the number of team members was different as well. For Surabaya and Semarang, we had 22 mapping team member that divided into 2 mapping supervisor, 4 Quality Data Assurance and 16 Spatial Data Entry. The mapping team divided into small groups where each group only consist of 2 Spatial Data Entry and each Quality Data Assurance being responsible to maintain data survey quality from 2 small groups or 4 spatial Data Entry. For each Mapping Supervisor, they had to supervised 2 Quality Data Assurance and maintain their team works including Spatial Data Entry. The team structure can be seen like this:
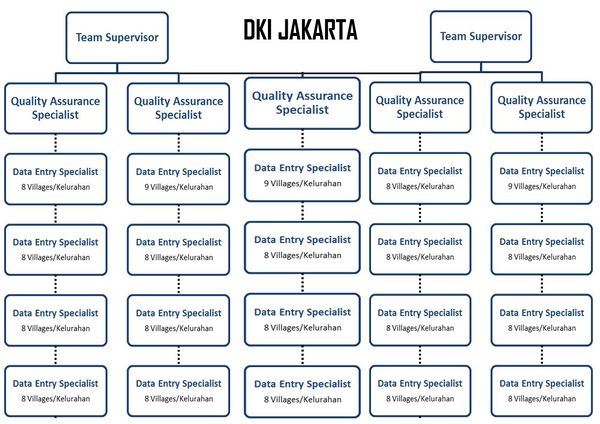
DKI Jakarta had a larger number of mapping team member because of its size almost two times bigger than Surabaya with 6 Kotamadya/City, 44 subdistricts, and 267 villages (kelurahan). Therefore, we added 1 Quality Data Assurance and 4 Spatial Data Entry so the total number of the mapping team member in DKI Jakarta was 27 people. They were divided into 2 mapping supervisor, 5 Quality Data Assurance and 20 Spatial Data Entry. In general, each position has a similar responsibility with Surabaya Project. The team structure can be seen as the picture below:
Mapping Tools and Methodology
Generally, There are 3 mapping steps in this project.
- Data Assessment and Data Model
- Digitize
- Field Survey
First step is the data assessment with the local government to identify the potential exposure data that used for disaster management. We created the data model for the specification and capture the enrich of the data and information.
Second step is digitize all building footprint and highway using HOT Tasking Manager. The purpose was to complete all the object before field survey and can be easily edit using OpenMapKit The project was given a high resolution satellite imagery by US GeoCenter so all digitizion result based on good and update satellite imagery.

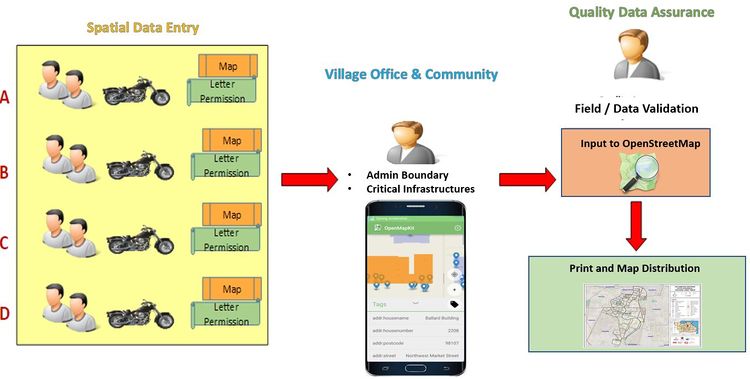
Third step is Field Survey using OpenDataKit (ODK) Collect and OpenMapKit as a GPS and Printed Survey Form replacement. The team go to the field using motorcycle and survey all infrastructures in their area as well as asking village office representative to update the administration boundary. The process for field survey can be seen in picture below:
Mapping Timeline
As have been mentioned above, Surabaya, Semarang and DKI Jakarta have different area size. Therefore, it determines how long the mapping activity going. Surabaya with a smaller area than the others area took around 5 months for its field survey area to be completed with the total duration was 6 months. The picture below shows Surabaya Mapping Timeline:

Semarang took a bit longer than Surabaya to be completed. Some factors contribute to this such as area size, city's landscape, and national public holiday for almost 2 weeks. The Semarang mapping activity takes 6 months to be finished. The picture below shows Semarang mapping Timeline:

The longest city to being surveyed was Jakarta with approximately around 7 months to be completed. There were some factors contributed to the duration such as heavy traffic jam, weather, and size of the survey area. The picture below shows a mapping schedule for the city of Jakarta:

Mapping Objects
Administrative Boundary
There are 4 administrative boundary that has been mapped (add and/or update) during this project.
- City/Regency Boundary
- Municipality Boundary
- Village Boundary
- Community Group (RW) Boundary
| No. | Object Name | Object Type | Description | Key | Value | OSM Rendering |
|---|---|---|---|---|---|---|
| 1. | City/Regency Boundary | A Boundary for City/Regency areas | admin_level | 5 |  | |
| 2. | Municipality Boundary | A boundary for Municipality areas | admin_level | 6 |  | |
| 3. | Village Boundary | A boundary for Village areas | admin_level | 7 |  | |
| 4. | Sub Village Boundary | A boundary for Community Group areas | admin_level | 9 |  | |
| 5. | Sub Sub Village Boundary | A boundary for sub sub villages areas. In Indonesia, it called Rukun Tetangga (RT) and the lowest level of administration boundary in Indonesia. HOT mapped and update some of RT Boundaries only in DKI Jakarta based on request from Local Disaster Management Agency (BPBD) DKI Jakarta. | admin_level | 10 |  |
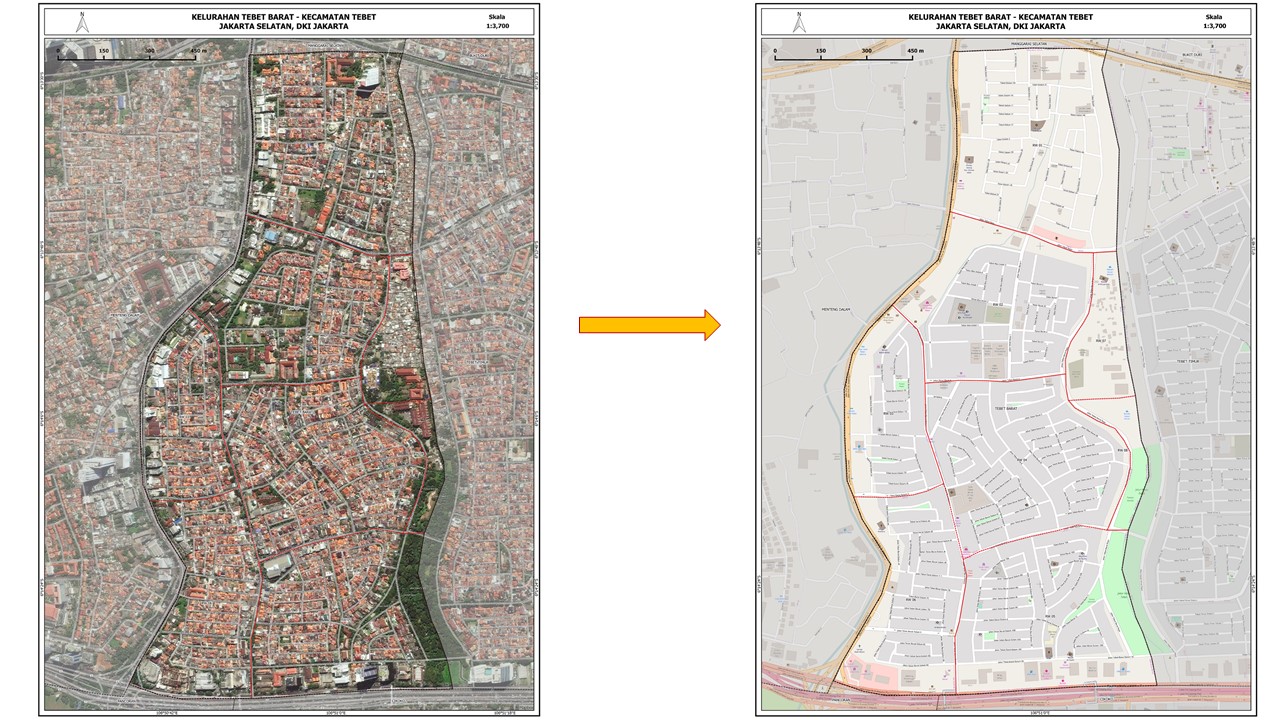
This is sample of how the administration boundary has been drawn in survey map and rendered into OpenStreetMap.
Critical Facilities
There are 11 critical facilities that become priority objects for PDC-InaWARE Indonesia Project:
- Finance
- Communication
- Transportation
- Water Supply System
- Electrical Power System
- Fuel Storage
- Public Institution
- Sport Facilities
- Health Facilities
- Emergency Services
- Government Establishments
Finance
| No. | Object Name | Object Type | Description | Key | Value | OSM Rendering | Sample Picture |
|---|---|---|---|---|---|---|---|
| 1. | Bank | A place that provides financial services for people, such as money deposit, money saving and credit for financial services. | amenity | bank |  |
Communication
| No. | Object Name | Object Type | Description | Key | Value | OSM Rendering | Sample Picture |
|---|---|---|---|---|---|---|---|
| 1. | Communication Tower | Tower to provide and deliver communication signal | man_made | communications_tower |  |
Transportation
| No. | Object Name | Object Type | Description | Key | Value | OSM Rendering | Sample Picture |
|---|---|---|---|---|---|---|---|
| 1. | Airports | A place for planes to arrived and departed | aeroway | aerodrome |  | ||
| 2. | Ferry Terminal | A place for ships to arrived and departed | amenity | ferry_terminal | |||
| 3. | Train Station | Rail passenger only station | public_transport | station |  | ||
| 4. | Bus Station | A place for buses to arrived and departed | amenity | bus_station |  |
Water Supply Systems
| No. | Object Name | Object Type | Description | Key | Value | OSM Rendering | Sample Picture |
|---|---|---|---|---|---|---|---|
| 1. | Fire Hydrants | An active fire protection measure, and a source of water provided in most urban, suburban and rural areas with municipal water service to enable firefighters to tap into the municipal water supply to assist in extinguishing a fire. | emergency | fire_hydrant |  | ||
| 2. | Water Towers | An elevated storage container for drinking water. | man_made | water_tower | 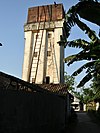 | ||
| 3. | Pumping Station | A station that manage and deliver water from river/land | man_made | watermill | 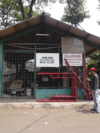 |
Electrical Power Systems
| No. | Object Name | Object Type | Description | Key | Value | OSM Rendering | Sample Picture |
|---|---|---|---|---|---|---|---|
| 1. | Generators | A device used to convert power from one form to another. | power | generator |  | ||
| 2. | Tower | tower that used to support an overhead power line. | power | tower |  | ||
| 3. | Substations | a large facilities (up to several acres) for very high voltage transmission lines or just small buildings or kiosks near the street for low voltage distribution lines. | power | substation |  | ||
| 4. | Power Plant | A place/industrial facility where power is generated. | power | plant |  |
Fuel Storage
| No. | Object Name | Object Type | Description | Key | Value | OSM Rendering | Sample Picture |
|---|---|---|---|---|---|---|---|
| 1. | Gas Station | Petrol station; gas station; marine fuel; … | amenity | fuel |  |
Public Institution
| No. | Object Name | Object Type | Description | Key | Value | OSM Rendering | Sample Picture |
|---|---|---|---|---|---|---|---|
| 1. | Kindergarten | Place for kids to learn (5-6 years old) | amenity | kindergarten | |||
| 2. | Sekolah Dasar (SD) / Madrasah Ibtidaiyah (MI) | Elementary School |
|
|
|||
| 3. | Sekolah Menengah Pertama (SMP) / Madrasah Tsanawiyah (MTs) | Junior High School |
|
|
|||
| 4. | Sekolah Menengah Atas (SMA) / Madrasah Aliyah (MA) | Senior High School |
|
|
 | ||
| 5. | College | A place for further education, usually a post-secondary education institution | amenity | college | |||
| 6. | University | An educational institution designed for instruction, examination, or both, of students in many branches of advanced learning. | amenity | university |  | ||
| 7. | Mosque / Mushala | Place of worship for moslem | |||||
| 8. | Church / Capel | Place of worship for christian |  | ||||
| 9. | Hindu Temple | Place of worship for hindu |  | ||||
| 10. | Buddhist Temple | Place of worship for buddhist |  | ||||
| 11. | Supermarket | A large store for groceries and other goods. | shop | supermarket |  | ||
| 12. | Pasar | A place where trade is regulated and traditionally, e.g. a square. | amenity | marketplace |  |
Sport Facilities
| No. | Object Name | Object Type | Description | Key | Value | OSM Rendering | Sample Picture |
|---|---|---|---|---|---|---|---|
| 1. | Stadion | A building which was built as stadium. Mostly for sport activities and big events | leisure | stadium |  |
 | |
| 2. | Sports Centre | TA distinct facility where a range of sports take place within an enclosed area. | leisure | sports_centre |  |
 | |
| 3. | Pitch | An area designed for playing a particular sport, normally designated with appropriate markings. | leisure | pitch |  |
 |
Health Facilities
| No. | Object Name | Object Type | Description | Key | Value | OSM Rendering | Sample Picture |
|---|---|---|---|---|---|---|---|
| 1. | Clinic | A medium-sized medical facility or health centre. | amenity | clinic |  | ||
| 3. | Hospital | institutions for health care providing treatment by specialised staff and equipment, and typically providing nursing care for longer-term patient stays. | amenity | hospital |  |
Emergency Services
| No. | Object Name | Object Type | Description | Key | Value | OSM Rendering | Sample Picture |
|---|---|---|---|---|---|---|---|
| 1. | Police Station | A station from which the police operates. | amenity | police |  | ||
| 2. | Fire Station | A station from which the fire brigade operates. | amenity | fire_station |  |
Government Establishment
| No. | Object Name | Object Type | Description | Key | Value | OSM Rendering | Sample Picture |
|---|---|---|---|---|---|---|---|
| 1. | Kantor RW | Community Group Office | |||||
| 2. | Kantor Desa/Kelurahan | Village Government Office | |||||
| 3. | Kantor Kecamatan | Subdistrict Government Office |  | ||||
| 4. | Kantor Bupati/Walikota | District Government Office | |||||
| 5. | Kantor Gubernur | Province Government Office | |||||
| 6. | Government Office | An office of a (supra)national, regional or local government agency or department | office | government |  | ||
| 7. | Kedutaan Besar | A representation of a country in another country. | amenity | embassy |  |
Required Key and Value for Any Building Objects for Critical Facilities
| No. | Information | Key | Value | Description | |
|---|---|---|---|---|---|
| 1. | Building Type | building | User Defined meaning that the value is determined by the user in accordance with the information of the building. | For example our object is school then we can add tag building=school. For further information please see here | |
| 2. | Building levels | building:levels | User Defined meaning that the value is determined by the user in accordance with the information of the building. | For example our object has 3 floors then we can add tag building:levels=3. For further information please see here | |
| 3. | Building Structure | building:structure |
|
the value is determined by the user in accordance with the information about the building structure. For example, the building has reinforced masonry structure then we can add tag building:structure=reinforced_masonry to the building. For more information please click here | |
| 4. | Building Addresss | addr:full | User Defined meaning that the value is determined by the user in accordance with the information of the building. | For example, our building located at Jalan MH.Thamrin then we can add tag addr=Jalan M.H Thamrin to the building. For more information please see here | |
| 5. | Building's Name | name | User Defined meaning that the value is determined by the user in accordance with the information of the building. | For example our building name Kafe Enak then we can add tag name=Kafe Enak to the building. For more information please see here | |
| 6. | Building Wall | building:walls |
|
Determined by what wall that the building has. For example the building builded with brick wall so we can add tag building:walls=brick to the building. For more information please see here | |
| 7. | Building Roof | building:roof |
|
Determined by what roof that the building has. For instance, the building has tile roff so we can add tag building:roof=tile to the building. For more information please see here | |
| 8. | Roof Access | access:roof |
|
If the building has an access to the roof then we have to add tag access:roof=yes and vice versa. For more information please see here | |
| 9. | City | addr:city |
|
A city where the infrastructure is located. For more information please see here | |
| 10. | Source | source |
|
A specific tag which indicated the objects has been surveyed by HOT Team and the year indicated when and where the objects being surveyed (2016 for Surabaya, 2017 for DKI Jakarta, and 2018 for Semarang). For more information please see here |
Roads, Railway and Water Object
There are 12 categories of road that has been mapped (add and/or edit) in this project.
- Motorway
- Trunk
- Primary
- Secondary
- Tertiary
- Residental
- Pedestrian
- Path
- Services
- Living Street
- Unclassified
- Track
| No. | Object Name | Object Type | Description | Key | Value | OSM Rendering | Sample Picture |
|---|---|---|---|---|---|---|---|
| 1. | Motorway | Free Way. Only for cars and it is paid road | highway | motorway |  |
 | |
| 2. | Trunk | Roads that connected administrative area. It can be city level, regency level or province level. | highway | trunk |  |
 | |
| 3. | Primary Road | Primary way in the mapping area. | highway | primary | 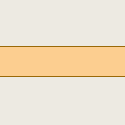 |
 | |
| 4. | Secondary Road | Secondary way in the mapping area. Connected with primary way | highway | secondary | 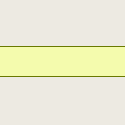 |
 | |
| 5. | Tertiary Road | Tertiary way in the mapping area. Connected with secondary way | highway | tertiary | 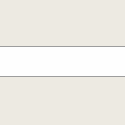 |
 | |
| 6. | Residential | Ways that located in residential area | highway | residential | 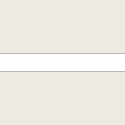 |
 | |
| 7. | Pedestrian | Ways for pedestrian. Any vehicles can not passing this way. Usually found in tourism area or shopping area | highway | pedestrian |  |
 | |
| 8. | Path | Way that can only passing by motorcycle and by foot. It width around < 1.5 meter. | highway | path |  |
 | |
| 9. | Service Way | Service way. Usually found in commercial building, mall and rest area. | highway | services | 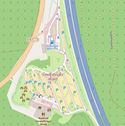
|
||
| 10. | Living Street | Small way in residential area. it's width around 1.5 - 2 meter. | highway | living_street |  |
 | |
| 11. | Railway | Path / way for train | railway | rail |  |
 | |
| 12. | River | The linear flow of a river, in flow direction. | waterway | river |  |
 | |
| 13. | Reservoir | an artificial lake is used to store water. | landuse | reservoir |  |
 | |
| 14. | River Bank | A wide river as defined by its area. | waterway | riverbank |  |
 |
Additional Attribute Information about Roads, Railway and Water Object
If you draw an object as a line object, you should add some additional information regarding the list of information below:
| No. | Information | Key | Value | Description |
|---|---|---|---|---|
| 1. | Road Direction | oneway |
|
Road direction information. If the road is a one-way road, user can give additional tag oneway=yes. For further information, see this link. |
| 2. | Layer (Tingkatan) | layer |
|
Layer information for line/road object. If the road is right above the ground level road, user can give additional tag layer=1 for the mapped road. If the road is right below the ground level road, user can give additional tag layer=-1 for the mapped road. For further information, see this link. |
| 3. | Road Lane | lanes | User Defined: the value is defined by user based on the information of the mapped object. | Lane information for road object. A road can have two or more lanes. Usually each lane separated by a dashed white line. For example, the mapped road is a three-lane road, user can give additional tag lanes=3 for that road. For further information, see this link. |
| 4. | Object Width | width | User Defined: the value is defined by user based on the information of the mapped object. | Width information for line/road object. This additional tag can be given to a road object or to another line object. For example, the width of the mapped road is 10 meters, user can give additional tag width=10 for that road. For further information, see this link. |
| 5. | Line Surface | surface |
|
Line surface information for the line/road object. For example, the mapped road has an asphalt surface, user can give additional tag surface=asphalt for that road. For further information, see this link. |
| 6. | Road Condition | smoothness |
|
Road condition describes the smoothness of the road and the type of vehicles that can pass the road without any damage. For example, the mapped road is in a quite good condition with some small potholes that usually found on main road, user can give additional tag smoothness=intermediate for that road. For further information, see this link. |
| 7. | City | addr:city |
|
A city where the infrastructure is located. For more information please see here |
| 8. | Source | source |
|
A specific tag which indicated the objects has been surveyed by HOT Team and the year indicated when and where the objects being surveyed (2016 for Surabaya, 2017 for DKI Jakarta, and 2018 for Semarang). For more information please see here |
Mapping Results
All the data and information that collected in the activities was uploaded into OpenStreetMap. The data also generated into the InAWARE platform, InAWARE limits their platform access to practitioners / disaster management experts and humanitarian workers such as BNPB, BPBD, and institutions that work with BNPB / BPBD. This is intended to maintain and priority access to critical information and protected data during emergencies and disasters.
For more details about the mapping results, we can visit the link https://openstreetmap.id/en/data-dki-jakarta/, https://openstreetmap.id/en/data-surabaya/, https://openstreetmap.id/en/data-semarang/
2. Atlas DKI Jakarta
Statistics of Mapping Result
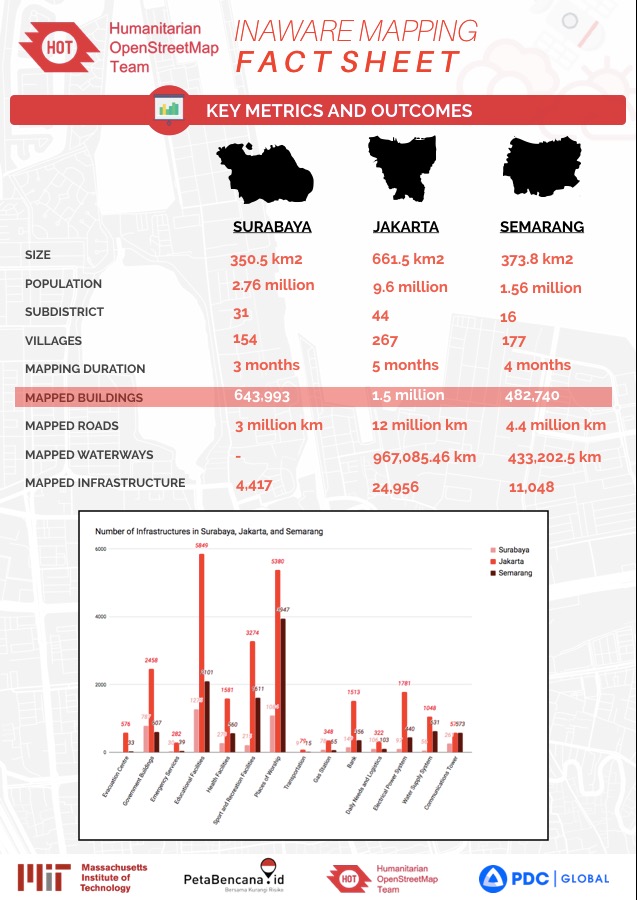
Statistics of Mapping activities of the project from 2016 to 2018 in 3 pilot cities can be seen in picture below:
Information
Email: perkumpulan@openstreetmap.id
Video documentation about the projects: https://www.youtube.com/@OpenStreetMapIndonesia


